




Published 14 November 2026
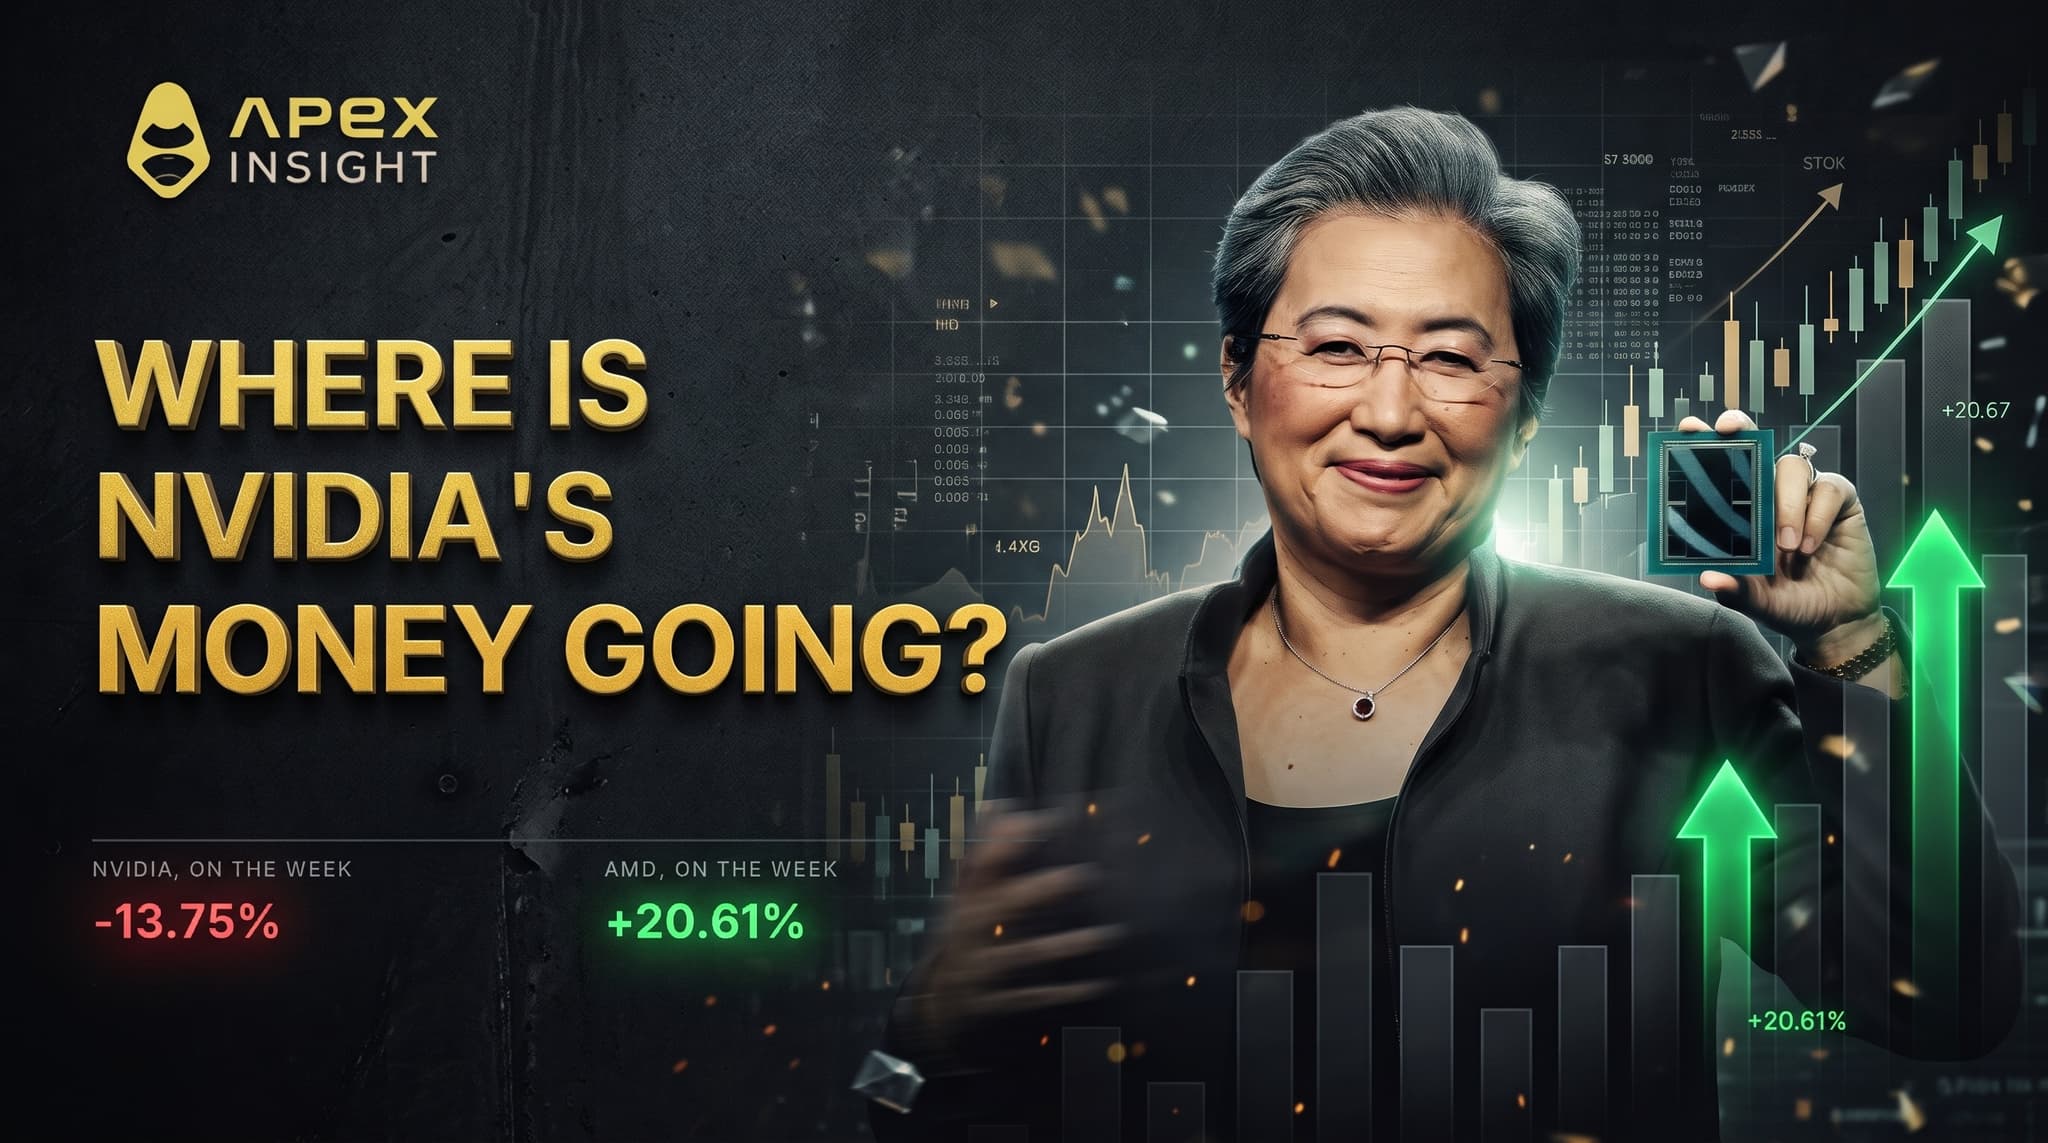
Nvidia had its worst week in the two hundred days of contract history our feed returns, which reaches back to 29 April. The companies that compete with it had one of their best. Those two sentences describe the same five trading days, and together they are the most interesting thing that happened in markets this week.
For most of the last two years, "the AI trade" and "Nvidia" meant the same thing. When Nvidia fell, everything near it fell. That stopped being true on Monday.
Written on 14 November 2026. US markets are shut for the weekend, so every equity figure here is measured to the Friday 13 November cash close and no weekend bar is quoted as a move in a share.
1. What actually happened
Here is the week on ApeX contracts, measured US cash close to cash close, from the 6 November close to the 13 November close.
Contract | Week |
|---|---|
+22.55% | |
+20.61% | |
+18.62% | |
+16.64% | |
+10.88% | |
+9.61% | |
-13.75% |
Of the sixteen equity and ETF contracts tracked here, Nvidia is the only one in its own sector that fell, and it did not fall slightly. The gap between Nvidia and AMD over five sessions is more than 34 percentage points.
The trigger is not in dispute. Jensen Huang resigned as chief executive on 12 November, effective immediately, and the board named chief financial officer Colette Kress interim chief executive. We published a piece on the key-person risk in this name that same morning; this article is about the other side of that trade, which is where the money went.
2. The four days, then Friday
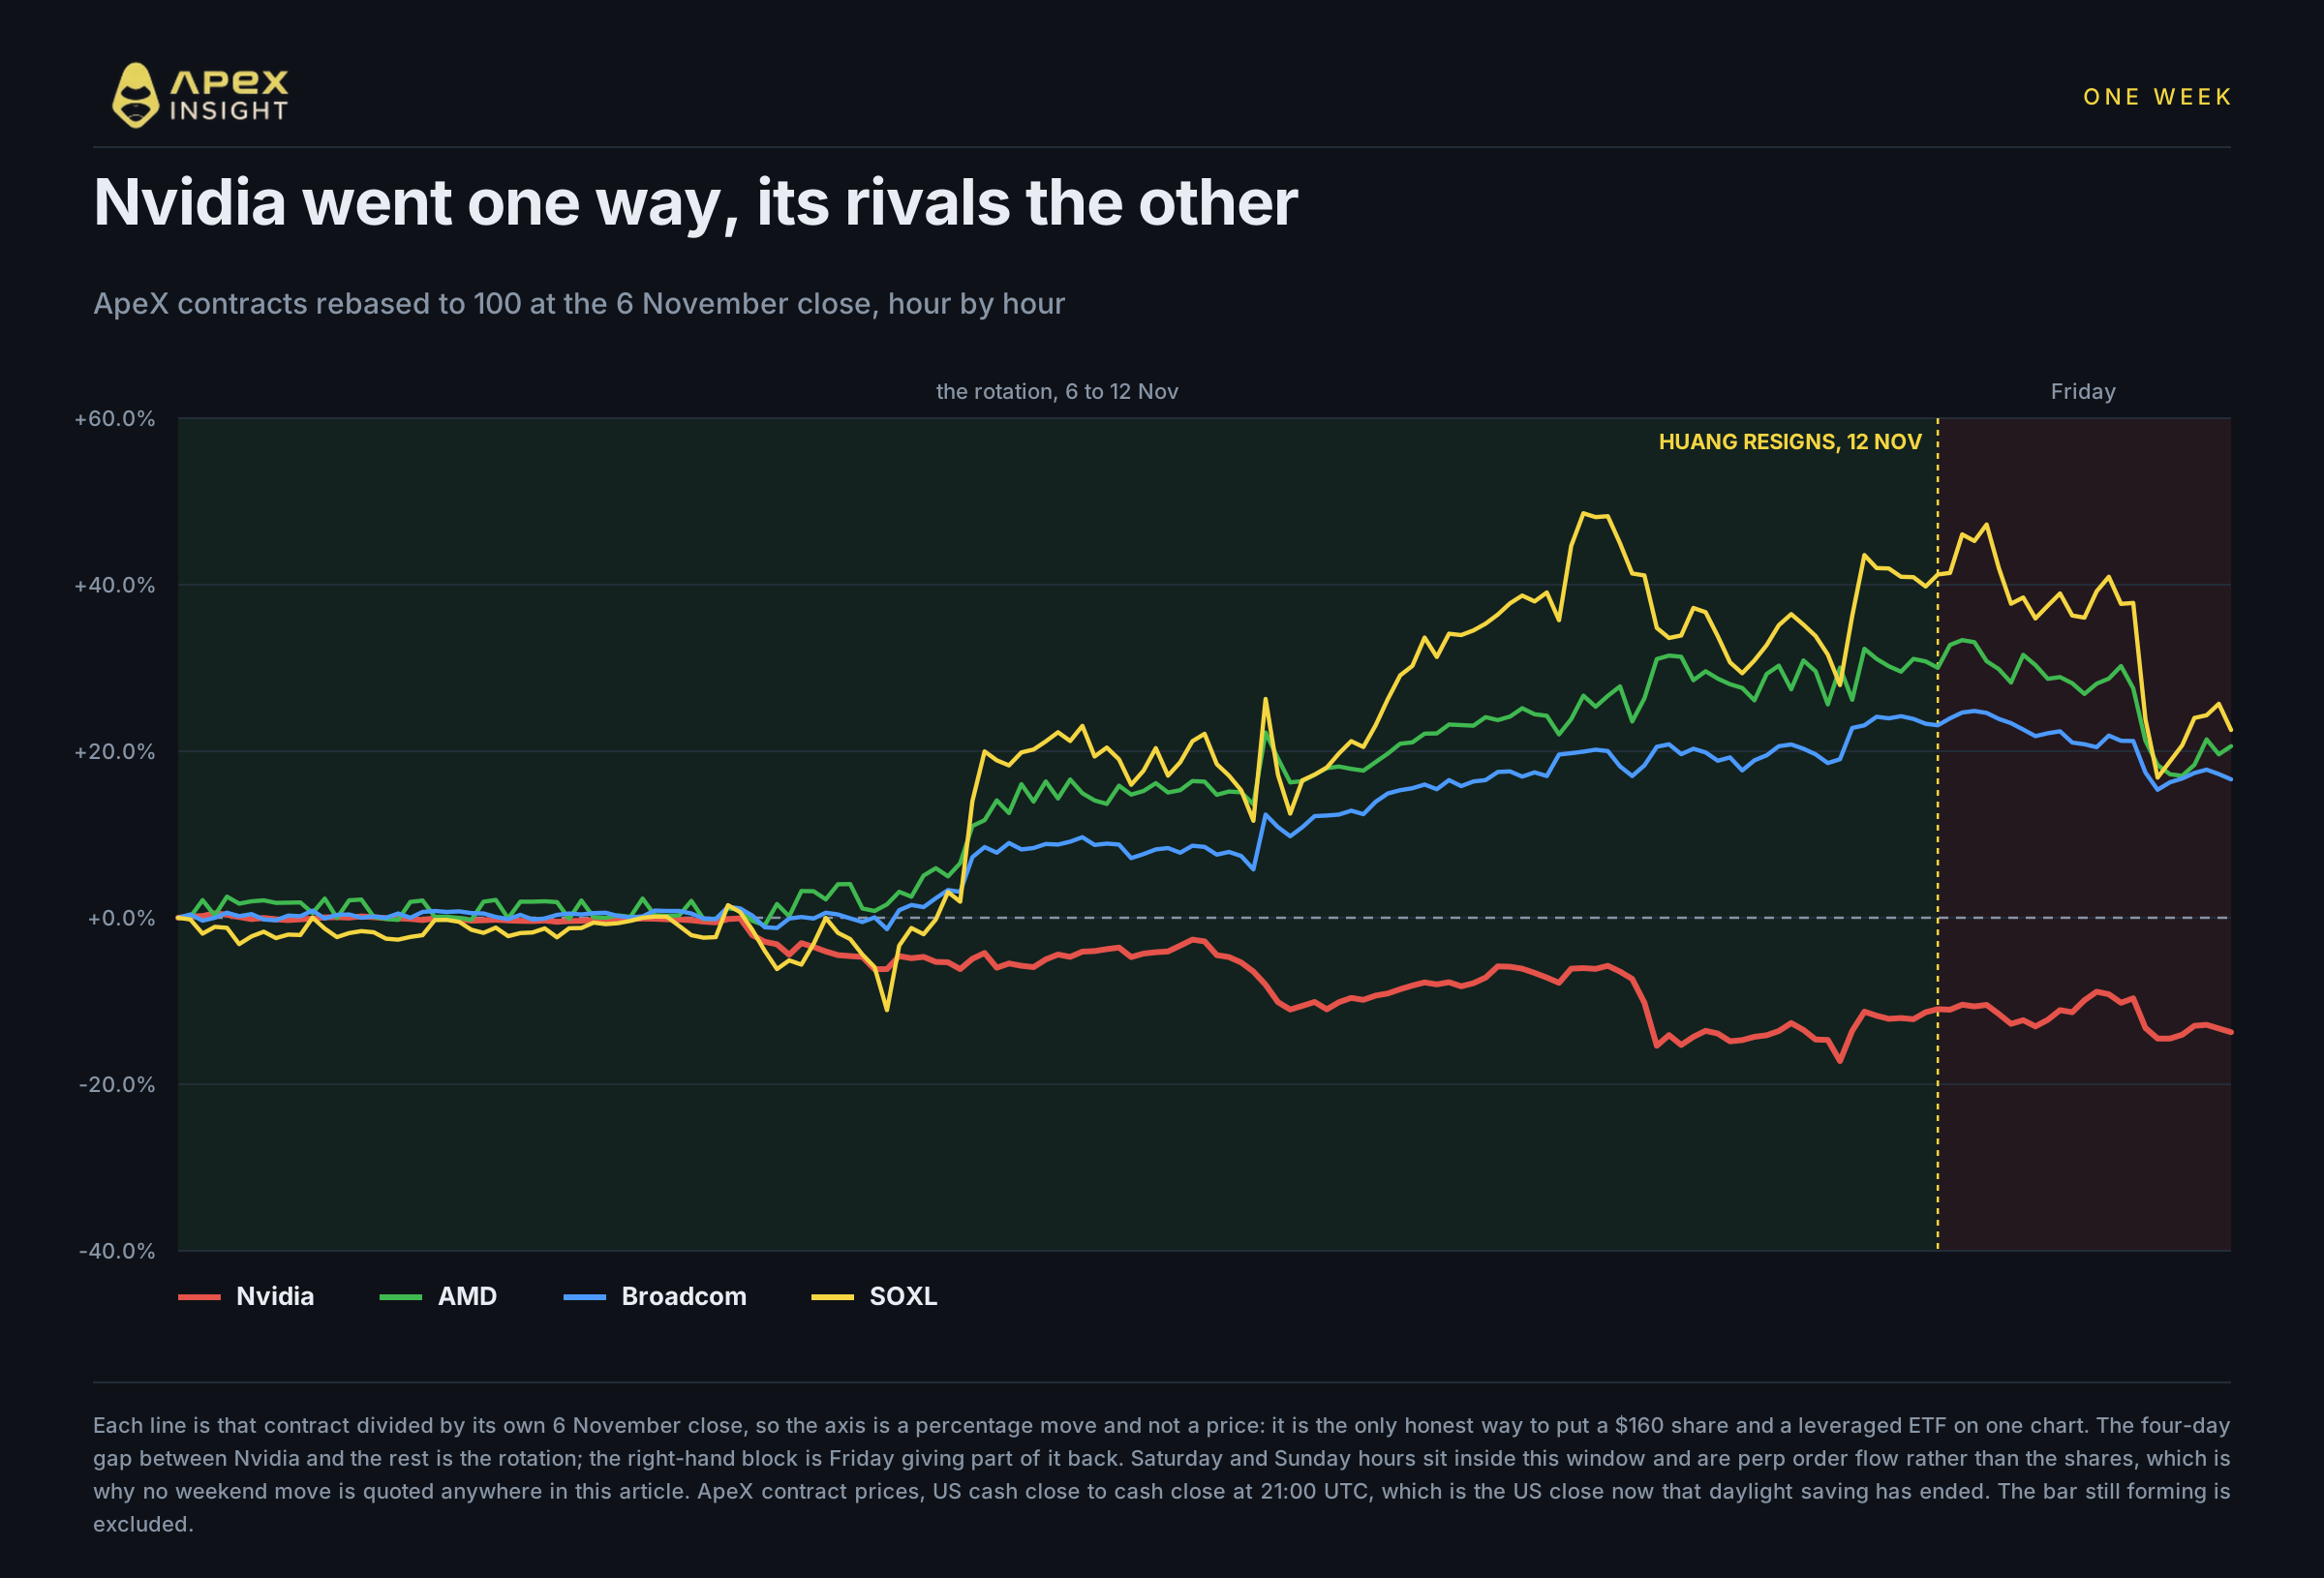
The week only makes sense when you split it in two. It contains a four-day stampede and a one-day reversal, and a single weekly number blends them into something that looks calmer than it was.
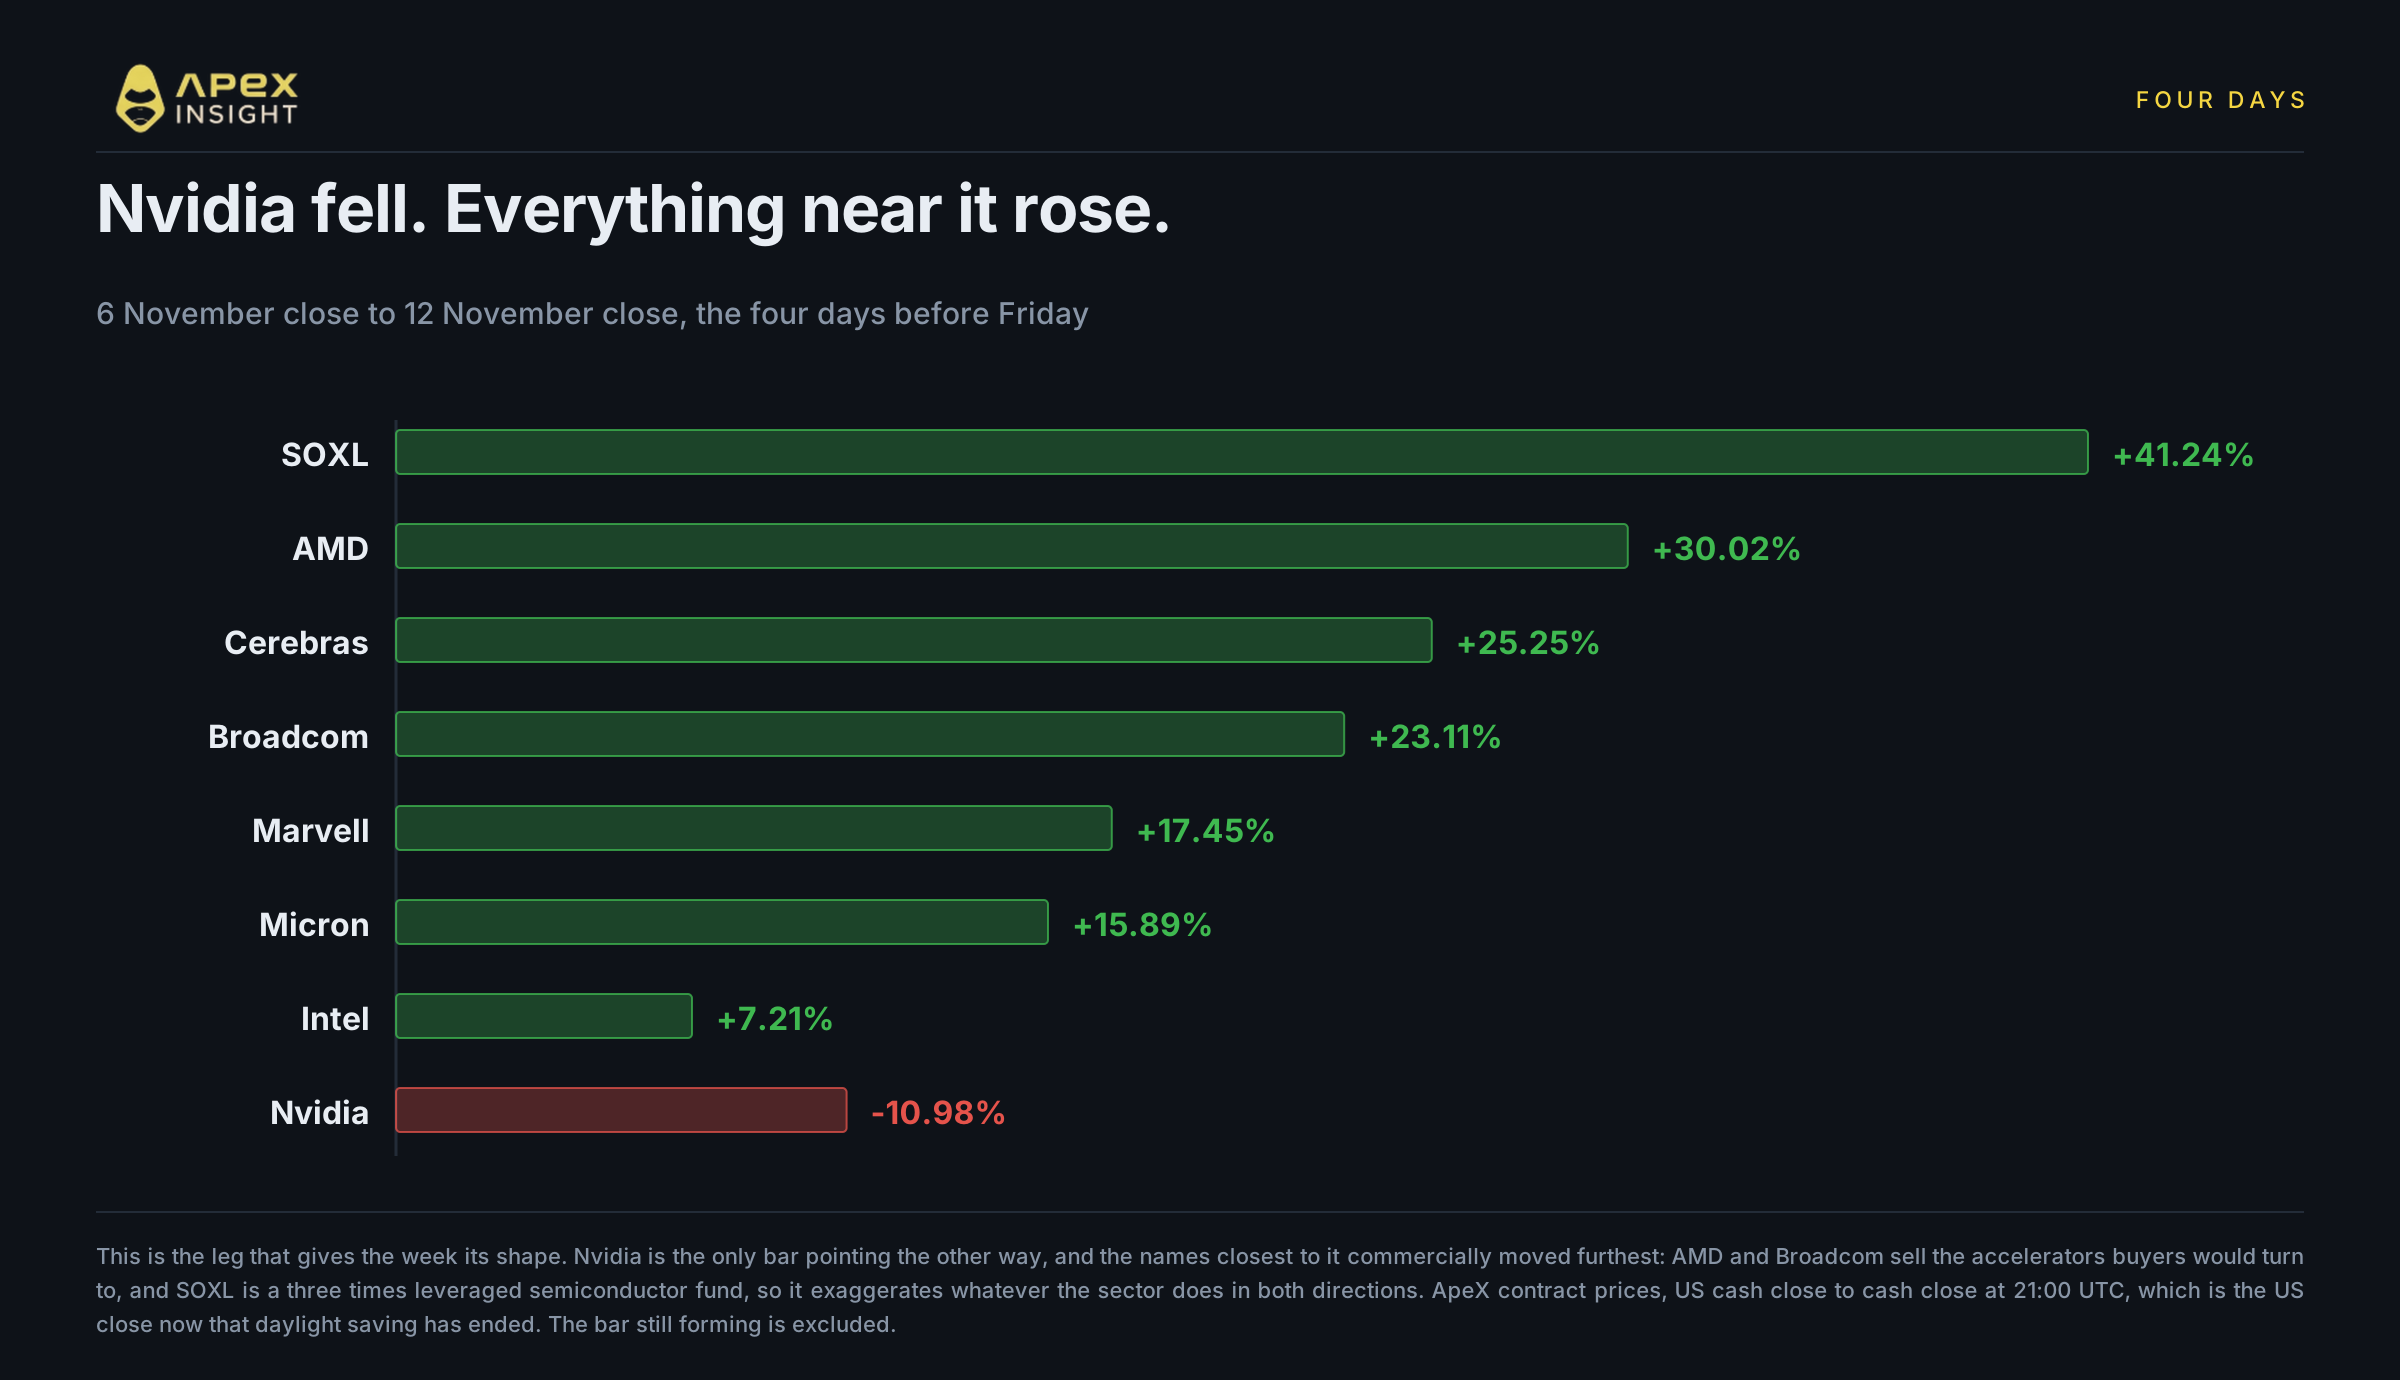
From the 6 November close through Thursday the 12th, the rotation leg, SOXL rose 41.24%, AMD 30.02%, Cerebras 25.25% and Broadcom 23.11%, while Nvidia fell 10.98%. Four sessions.
Then Friday.
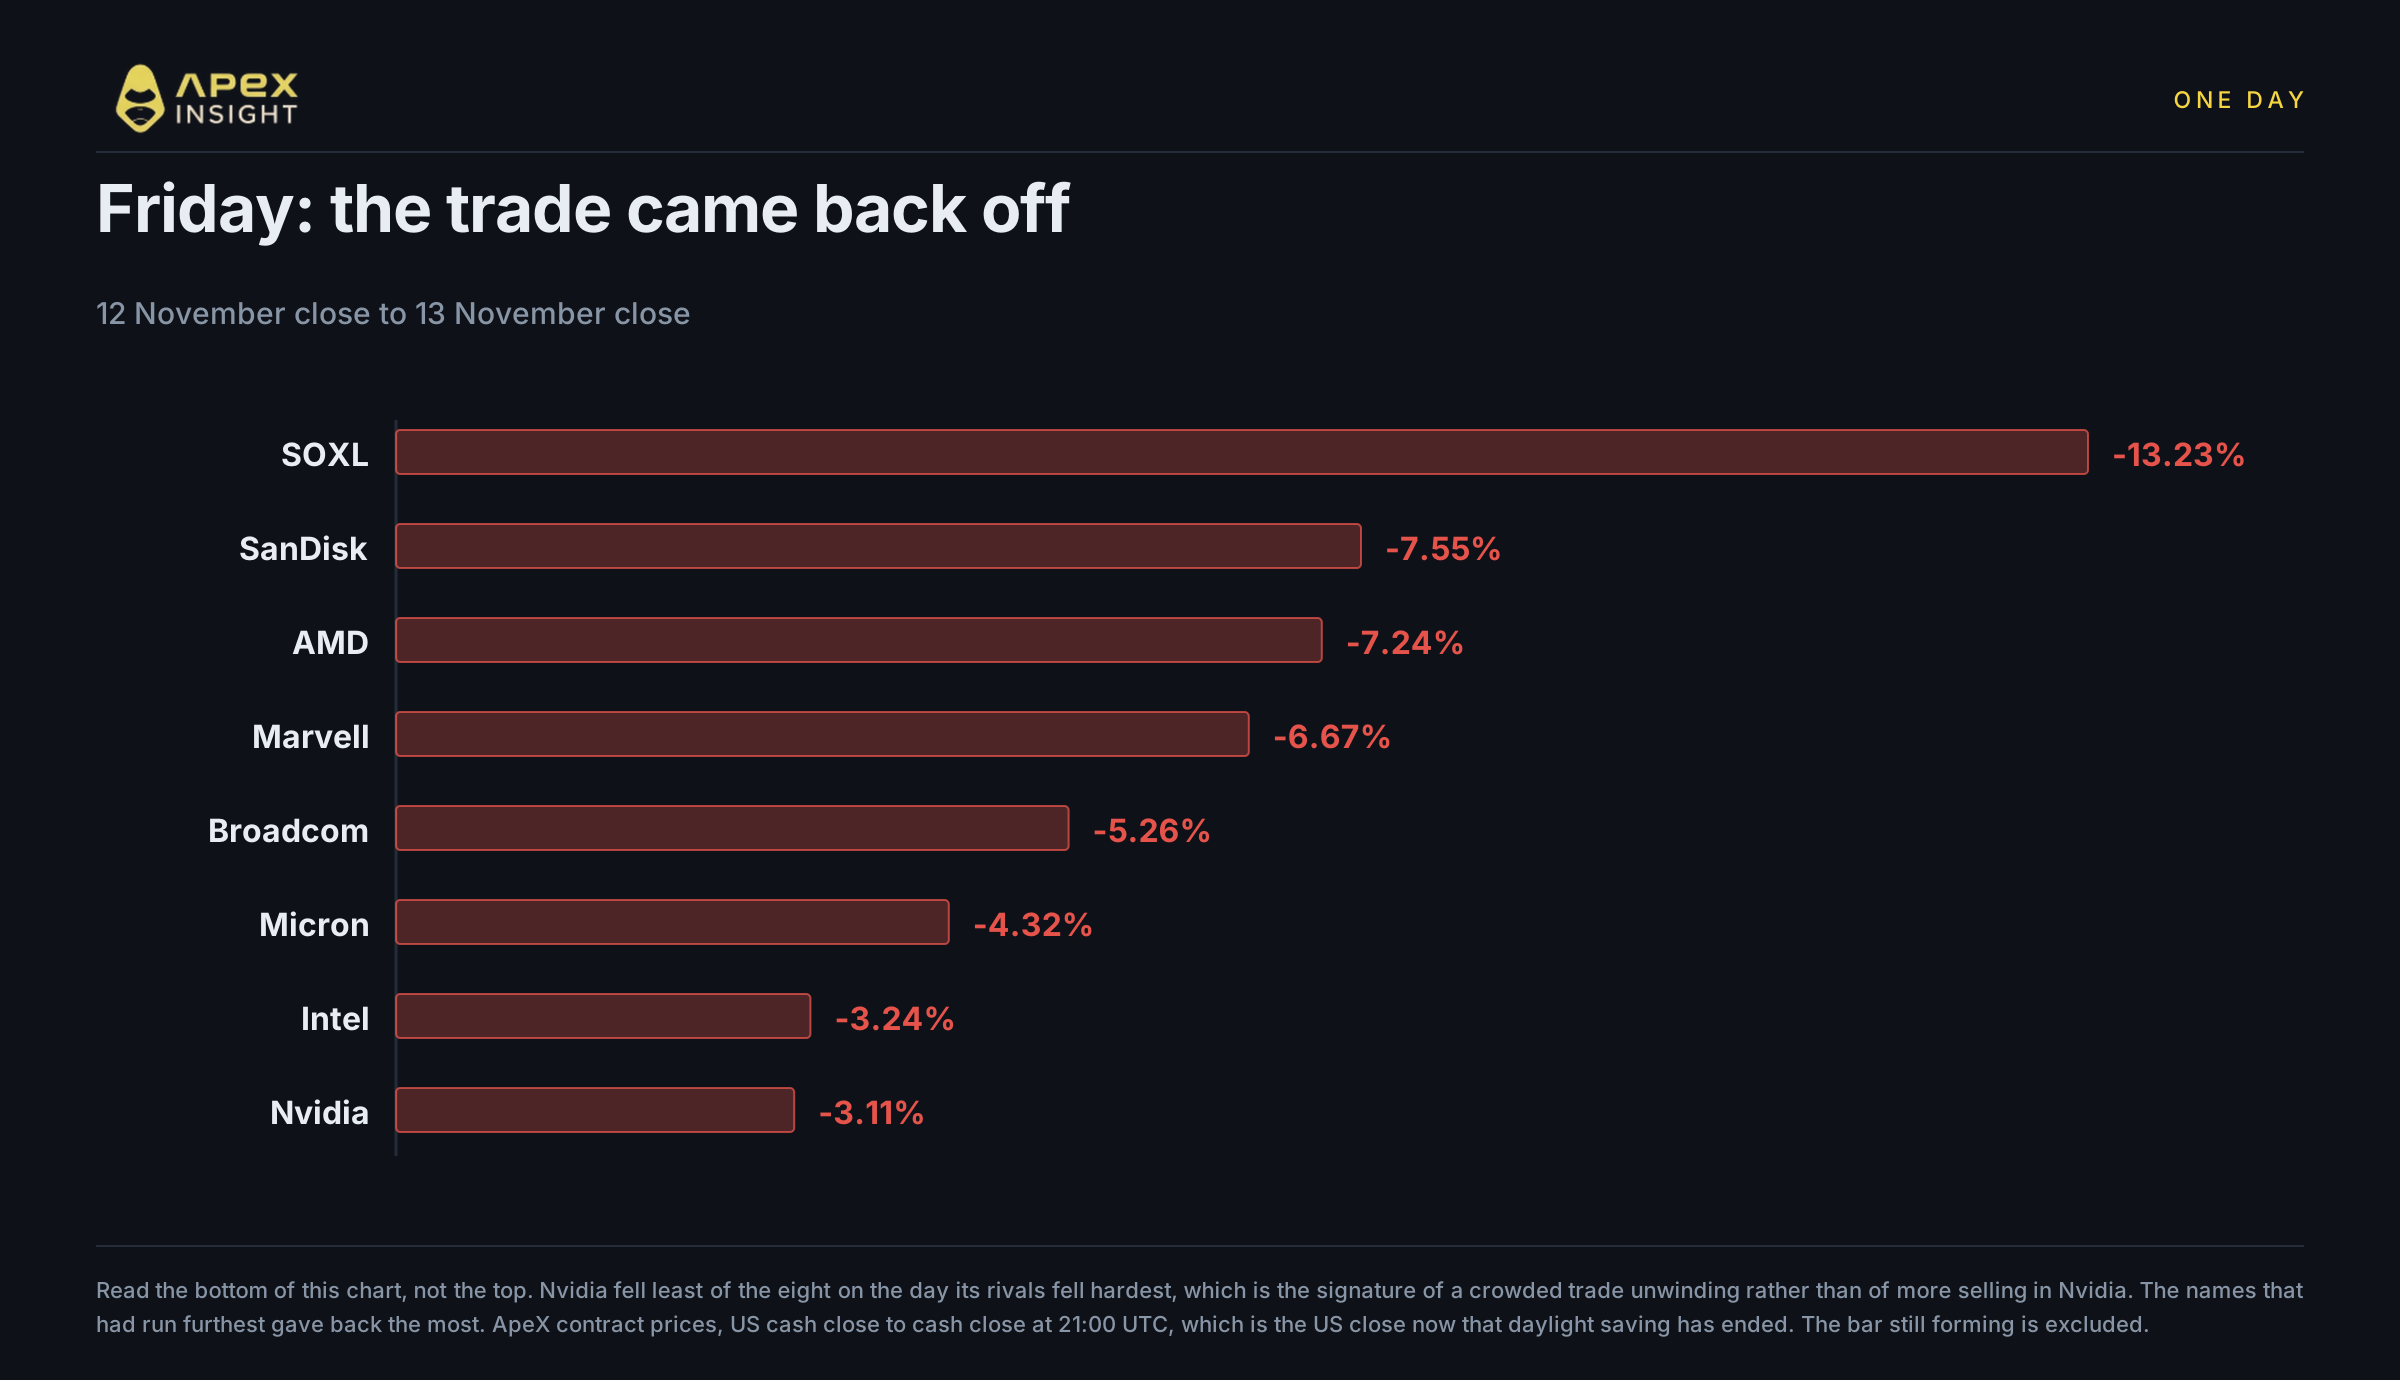
On Friday the whole thing came off. SOXL fell 13.23%, SanDisk 7.55%, AMD 7.24%, Marvell 6.67% and Broadcom 5.26%. Nvidia fell 3.11%.
Read that list from the bottom. On the day the rivals fell hardest, Nvidia fell least of the eight contracts on that chart. If Friday had been more Nvidia selling, Nvidia would have led the decline. It did the opposite. What unwound on Friday was the rotation itself, not the original trade, and the names that had run furthest gave back the most. In the cash market the same shape appeared: AMD sank 8.8%, Broadcom lost 4.8% and Marvell 4.7%, all three declining more than both Nvidia, down 2.0%, and the iShares Semiconductor ETF, which fell 3.7%.
Our contract figures and the cash figures differ by one to two points on the week. That is normal and worth saying plainly: the perpetual is its own market with its own basis, and it is not the share.
3. Did the money actually move, or did it just vanish?
This is the question that separates a rotation from a selloff, and it has a real answer this week.
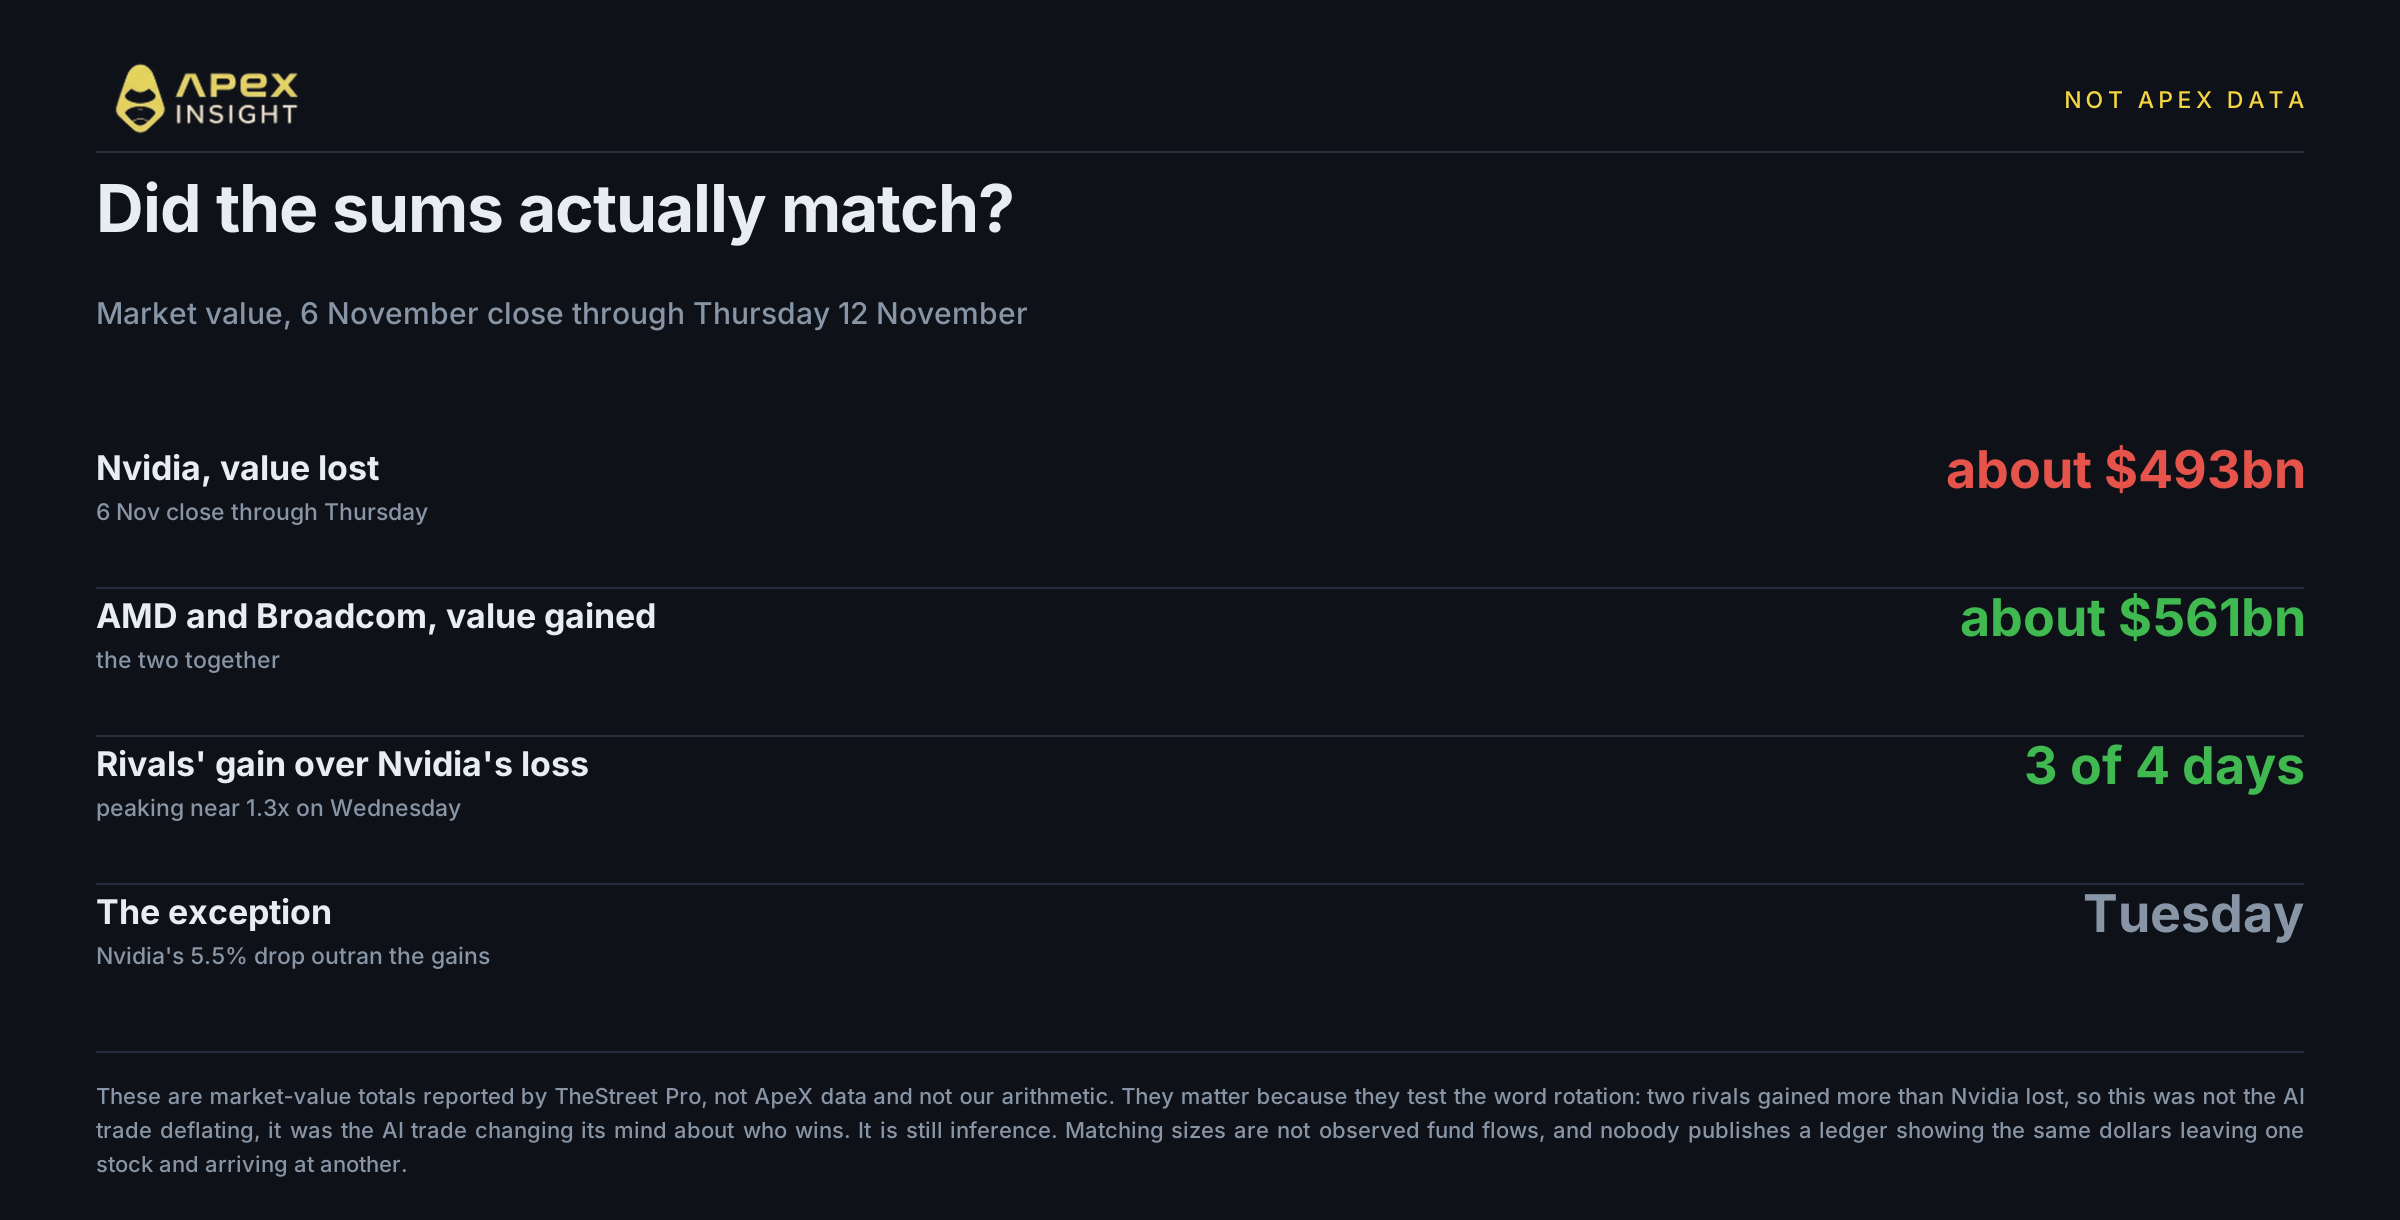
From the November 6 close through Thursday, Nvidia lost about $493 billion in market value, while AMD and Broadcom combined gained about $561 billion. The rivals' combined gain exceeded Nvidia's loss on three of the four days, peaking at about 1.3 times on Wednesday. Tuesday was the exception, when Nvidia's 5.5% drop outran its rivals' gains.
Two companies gained more than the largest company in the sector lost. That does not read as a sector derating. It reads as the market changing its mind about who captures the profit, and pricing the change at roughly full size.
The honest caveat belongs here rather than buried at the end. Nobody publishes a ledger showing the same dollars leaving one stock and arriving at another. What we have is co-movement of the right sign, in the right names, at roughly the right size, with an obvious mechanism. That is strong circumstantial evidence and it is not proof. For Friday's reversal, a 24/7 Wall St columnist reads it as profit taking after a fast run, which is a reminder that the simplest reading is usually the right one, in both directions.
4. The trend started before the resignation
It would be neat to say the chief executive resigned and the stock broke. The chart does not support it.
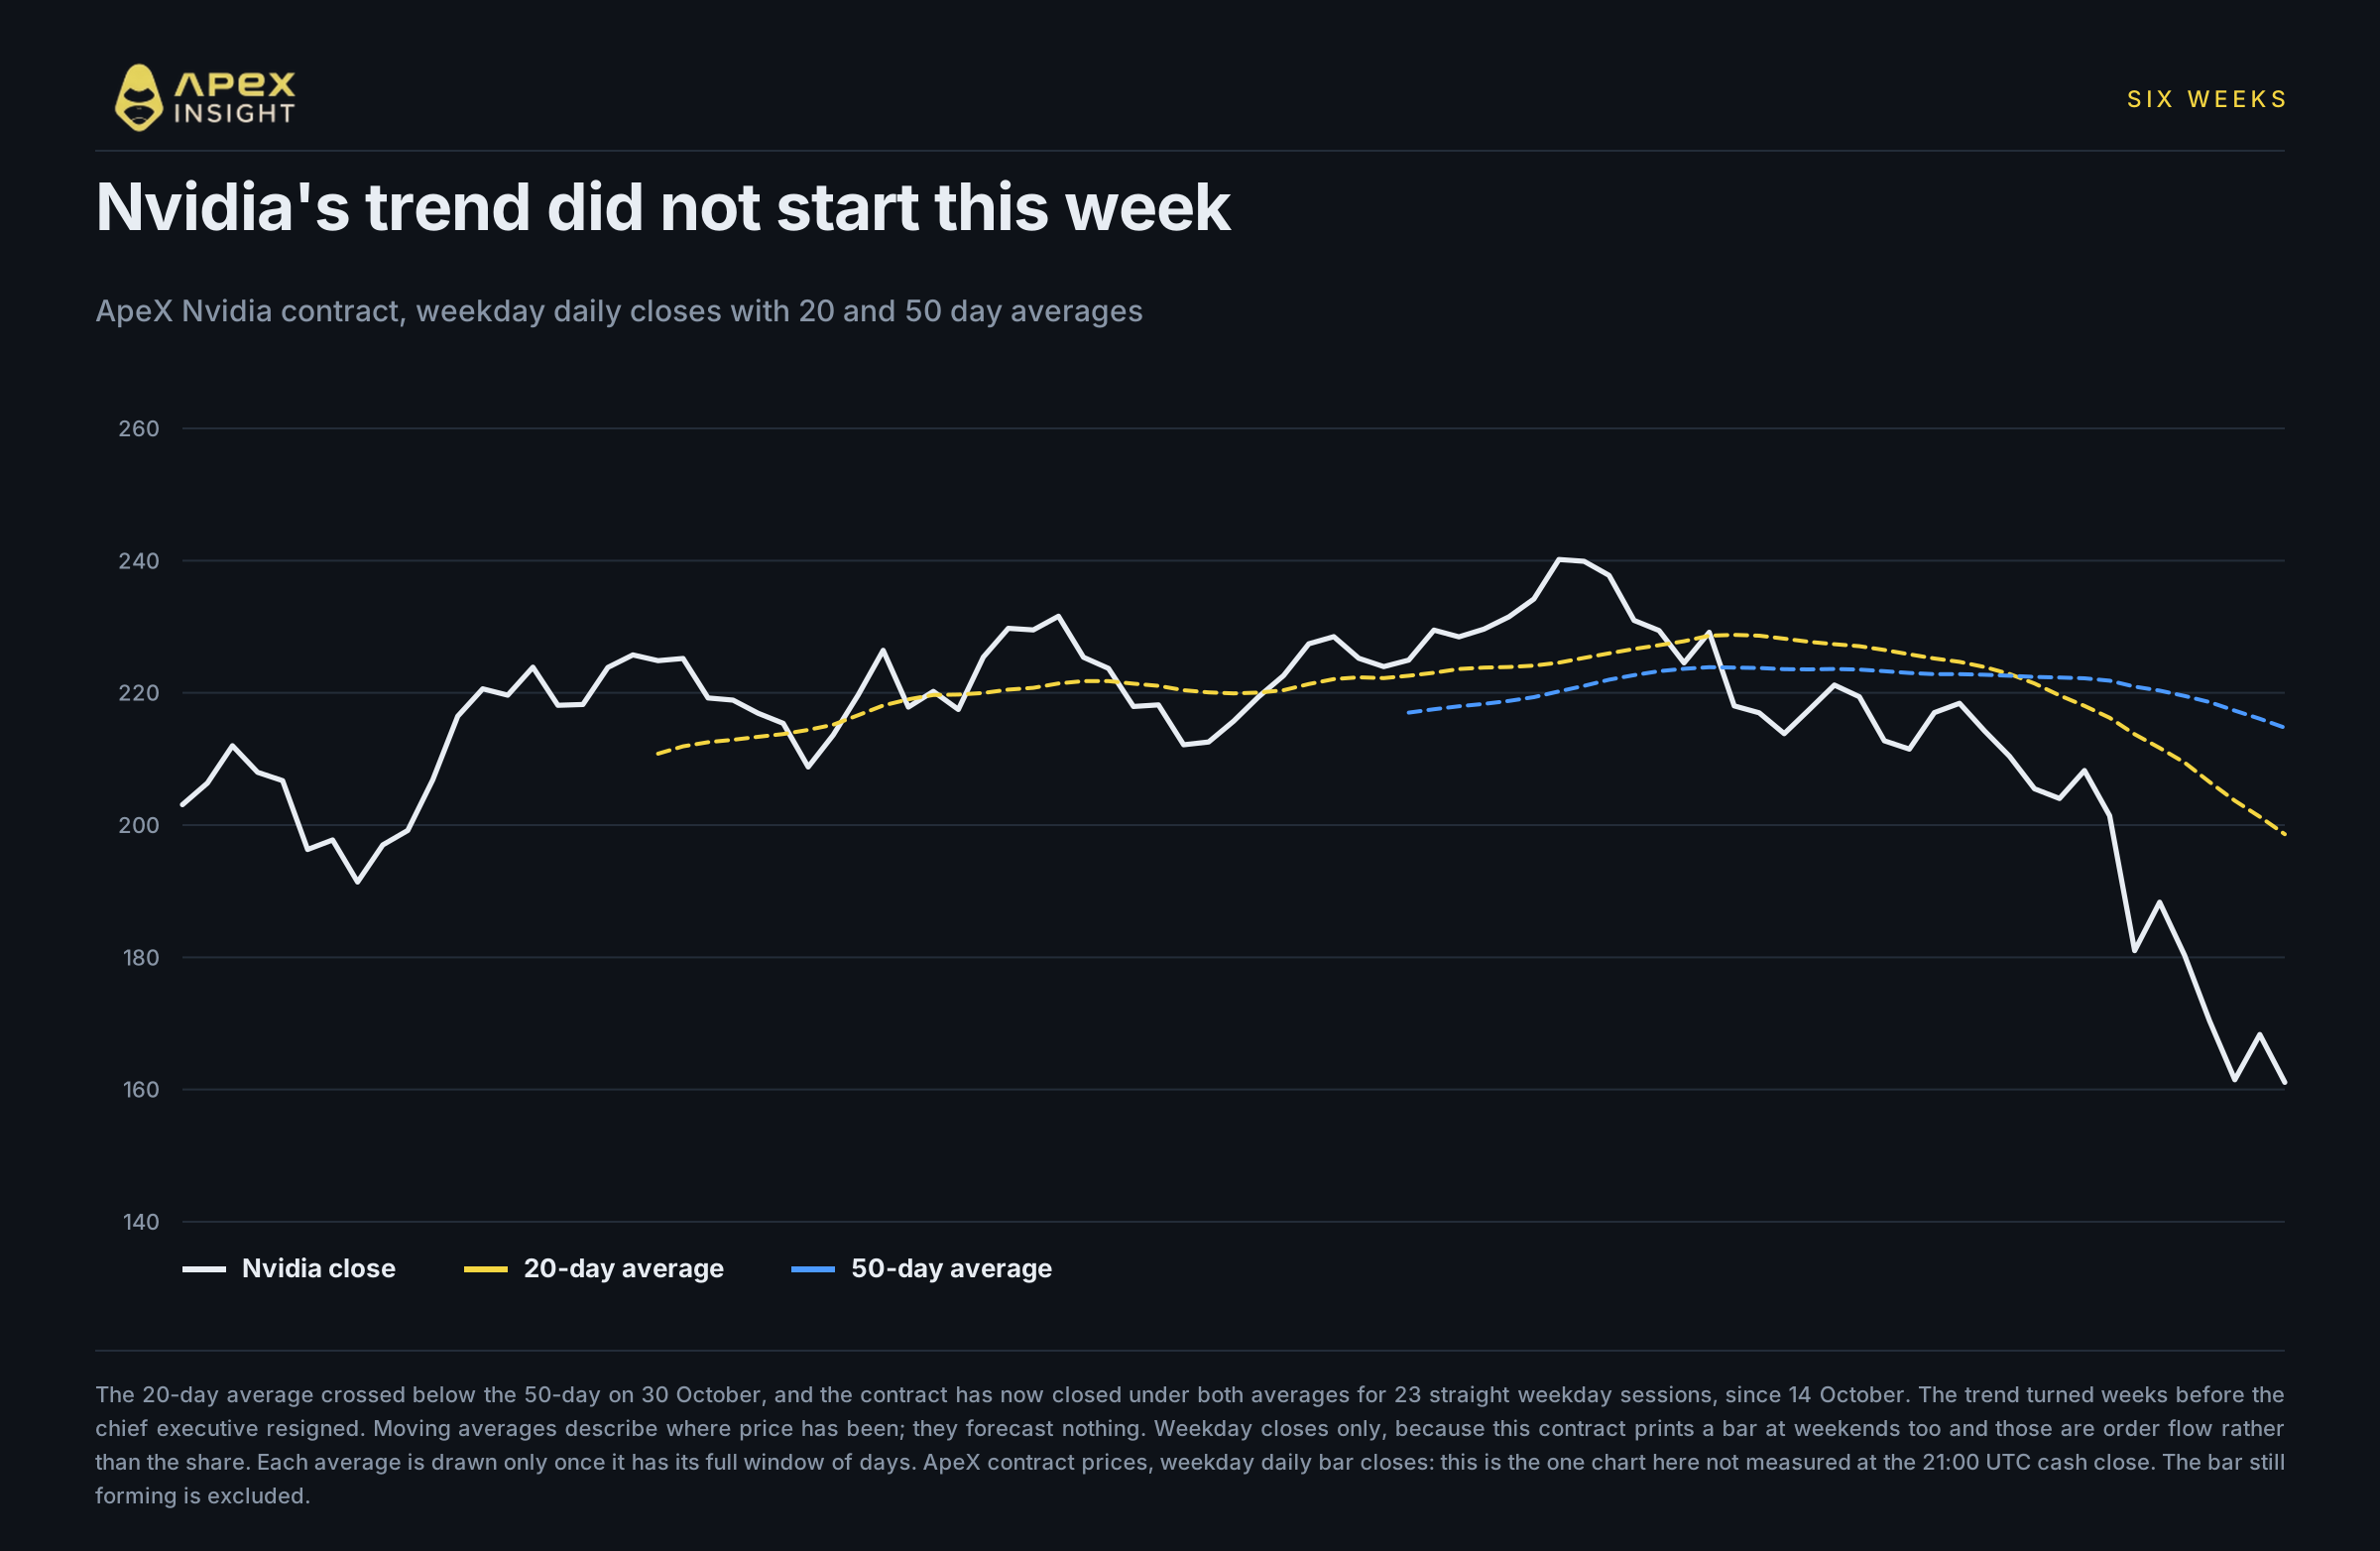
On our contract, measured Friday close to Friday close, this was Nvidia's sixth consecutive down week, and those six weeks together take 30.74% off the price. The 20-day average crossed below the 50-day on 30 October, nearly two weeks before the resignation, and the contract has now closed below both averages for 23 straight weekday sessions, since 14 October.
The cash market tells the same story: Nvidia ended the week at $162.85, down 12.75%, and about 30% over a six-week losing streak that CNBC says is its longest since 2012, with its market capitalisation closing below $4 trillion.
So the resignation did not start the decline. What it looks like it did was give the market a reason to act on a view it had been forming for six weeks, and to express that view by buying something else rather than by selling the sector.
5. Where it did not go
A useful way to test "rotation" is to check the places money goes when investors are frightened rather than reallocating.
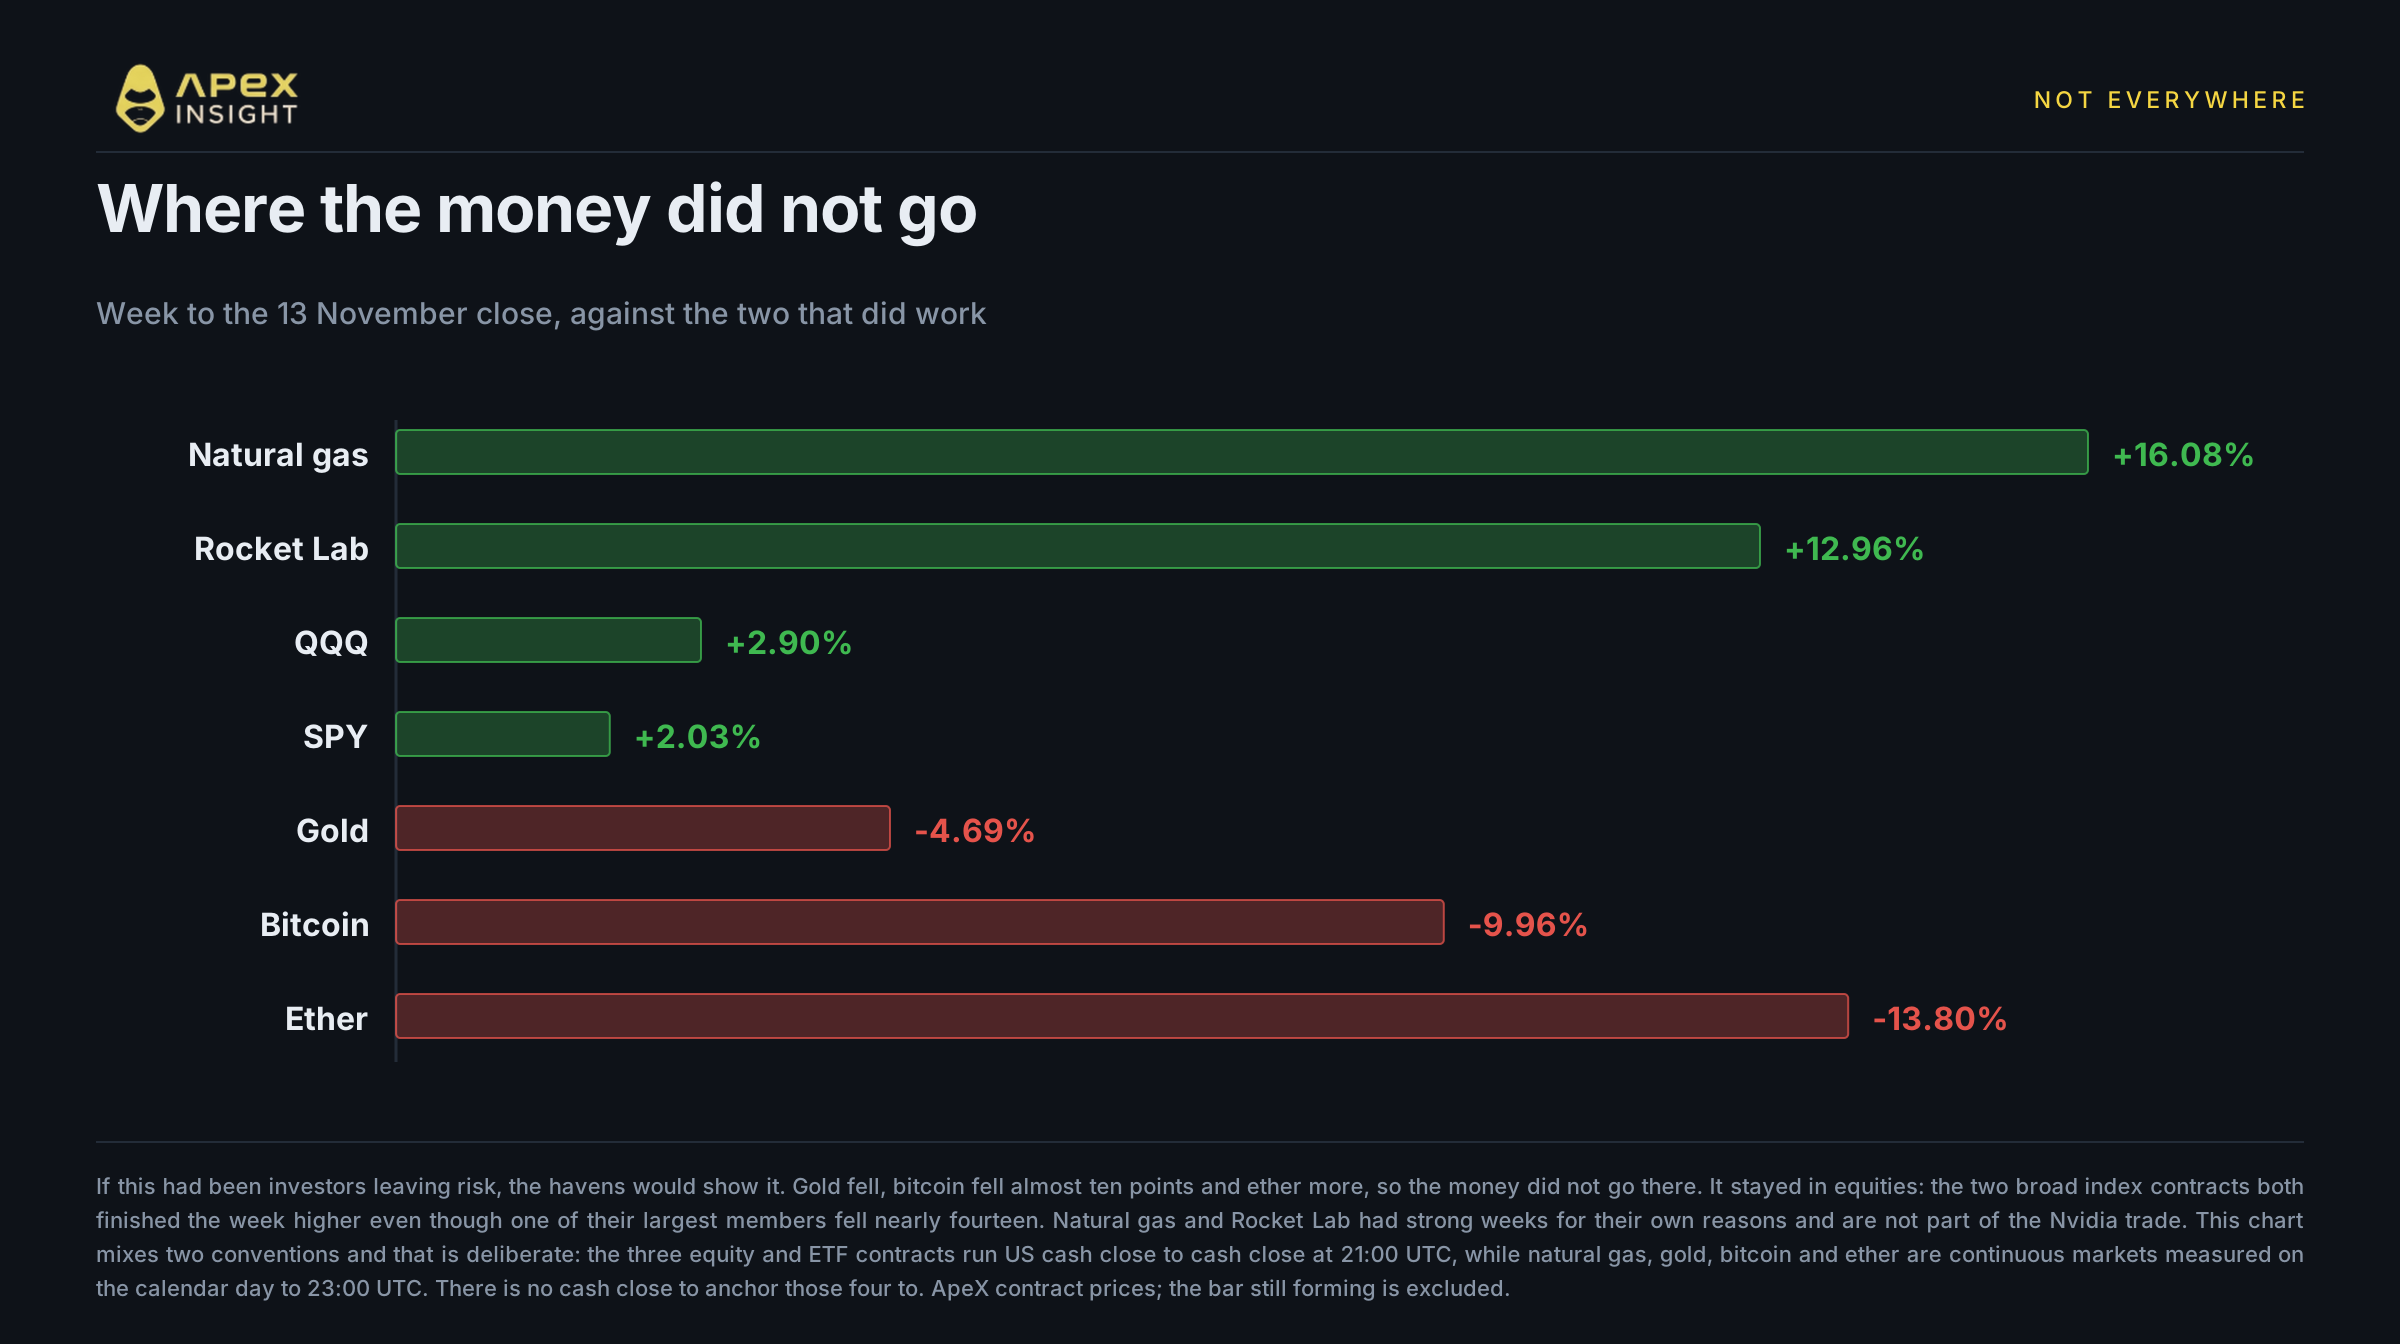
Gold fell 4.69% on the week. Bitcoin fell 9.96% and ether 13.80%. We covered that crypto week in its own right yesterday, and the short version is that it was a dollar and rates story rather than a crypto one. None of these are where frightened money went.
Meanwhile the two broad index contracts both rose: QQQ 2.90% and SPY 2.03%. The S&P 500 and Nasdaq snapped four-week losing streaks with solid weekly gains.
Hold those two facts together, because the combination is the whole article in miniature. The Nasdaq-tracking contract rose 2.90% in a week when one of its largest members fell 13.75%. For most of the last two years the index followed Nvidia closely enough that this would have been surprising. This week the index absorbed it.
Friday did see a genuine defensive bid, but it lasted one day: technology closed the weakest of the eleven sectors at -2.01%, while consumer staples led at +1.42% and the equal-weighted S&P 500 gained 0.20%, with staples, communications, financials, health care and utilities all advancing.
6. Why the rivals, specifically
The names that moved most are the ones a buyer would actually switch to. AMD and Broadcom sell accelerators and custom AI silicon into the same budgets, and on our contract history AMD, Broadcom and Cerebras each had their best week of the period our feed covers. SOXL, Marvell and Micron did not, which is worth knowing before calling this a record week for the sector. AMD gained 18.9%, Broadcom 18.2% and CoreWeave 14.5% from the 6 November close in the cash market.
SOXL deserves its own note because it is the most extreme number on the page and the most easily misread. It is a three times leveraged semiconductor fund, so a +22.55% week does not mean the sector rose 22.55%. It tracks three times the sector's daily move and compounds, which over a week of sharp swings in both directions pulls the result away from a simple third. Leverage cuts the other way too, and it did: the triple-leveraged chip fund fell 11% on Friday and 54% in a month, and a double-leveraged AMD fund fell 18%. A contract that is 71.45% below its 200-day high after a +22.55% week is telling you how much damage preceded this bounce.
It is also worth noting who was not convinced. Michael Burry said he added to bearish Nasdaq 100 and chip bets, calling the rebound a bull trap, and Rothschild & Co Redburn downgraded Broadcom to Neutral into the rally.
7. What happens next
Two dated things.
Nvidia reports on 17 November, after the US close. It will report with an interim chief executive and no permanent successor named. That is three days after this piece publishes and it is the single event most likely to settle whether this week's rotation was right.
The succession itself is unresolved, and the reporting on it conflicts. The Financial Times reported on Friday that Nvidia's board had approached Arm chief executive Rene Haas as a potential successor, citing people familiar with the matter, and Arm shares fell 4.63% on the day. But the Nvidia board told CNBC on the 13th that they "have not yet officially contacted any potential candidates", that "any speculation about specific individual candidates, whether internal or external, is premature", and that they are in the process of selecting an external headhunting firm. One is anonymously sourced reporting and the other an on-the-record statement, and they do not agree. Treat the succession as open.
There is a rates leg underneath all of this too, which is where the last two articles in this series ended up as well. Bank of America now expects quarter-point hikes in December, January and March, taking the rate from 3.75%-4% to a peak of 4.5%-4.75%, with no cuts in 2027 or 2028. A higher discount rate hurts the most expensively valued thing in a sector first, and for two years that has been Nvidia.
Trade the move on ApeX
NVDA, AMD, AVGO and SOXL perpetuals, up to 50x, trading 24/7.
Everything below trades 24/7 on ApeX, which matters this weekend specifically: the cash market is shut until Monday and Nvidia reports on Tuesday.
The name itself. NVDA-USDT is 33.40% below its 200-day high, in a six-week downtrend, with earnings on Tuesday and no permanent chief executive. Both directions have a real case, which is why the option is worth stating rather than the view.
The other side of the rotation. AMD-USDT and AVGO-USDT are the two contracts that absorbed the money. Both are now the crowded side of a trade that already failed once, on Friday.
The leveraged expression. SOXL-USDT moved 41.24% up and 13.23% down inside one week. It is the cleanest way to express a sector view and the fastest way to be wrong about one.
The ones that have nothing to do with it. NATGAS-USDT rose 16.08% on the week and sits 6.72% off its 200-day high, and RKLB-USDT rose 12.96%. Neither is part of this story, which is the point of mentioning them.
Trading carries a high risk of loss, and leverage increases both gains and losses. A trade that gained 41% in four days and gave back 13% in one is the clearest possible illustration of that, in both directions. This is not financial advice and none of it is a recommendation to buy or sell anything. Do your own research and size positions you can afford to lose.
If you need any help, feel free to reach out to our team on Discord.
Website: https://www.apex.exchange
Twitter: https://twitter.com/OfficialApeXdex
Telegram: https://t.me/ApeXdex
Methodology. Contract figures are from the ApeX Omni v3 API, recomputed on 14 November 2026. Equity and ETF contracts are measured US cash close to cash close at 21:00 UTC, which is the US close now that daylight saving ended on 1 November 2026; the week window runs from the 6 November close to the 13 November close, the rotation leg from 6 to 12 November, and the Friday leg from the 12 to the 13 November close. True 24-hour markets, meaning natural gas, gold, bitcoin and ether here, are measured on the calendar day to 23:00 UTC. ApeX equity contracts trade 24/7 and print a bar every calendar day, but weekend bars are perp order flow rather than the underlying share, so they never bound a window and no weekend move is quoted as a move in a stock; the daily chart and its moving averages use weekday closes only. The bar currently forming is always excluded. Distance from the 200-day high excludes the first bar the feed returns for each contract, because a genuine listing bar opens at a placeholder rather than a market price. For contracts at the feed's 200-bar ceiling, including Nvidia, that first bar is the window edge rather than a listing, and excluding it changes none of the figures quoted here. The perpetual is its own market and carries a basis to the cash share, which is why our figures and the cash figures quoted from external sources differ: by one to two points on the single names and by more on SOXL, where a leveraged fund's contract and its cash price diverge further. Both are labelled throughout. Market-value totals, index and sector moves, cash closing prices, the CNBC streak record, the succession reporting and the Bank of America forecast are from the sources hyperlinked at each claim and are not ApeX data. Figures are as at the 13 November 2026 cash close and will go stale quickly. Nothing here is financial advice.