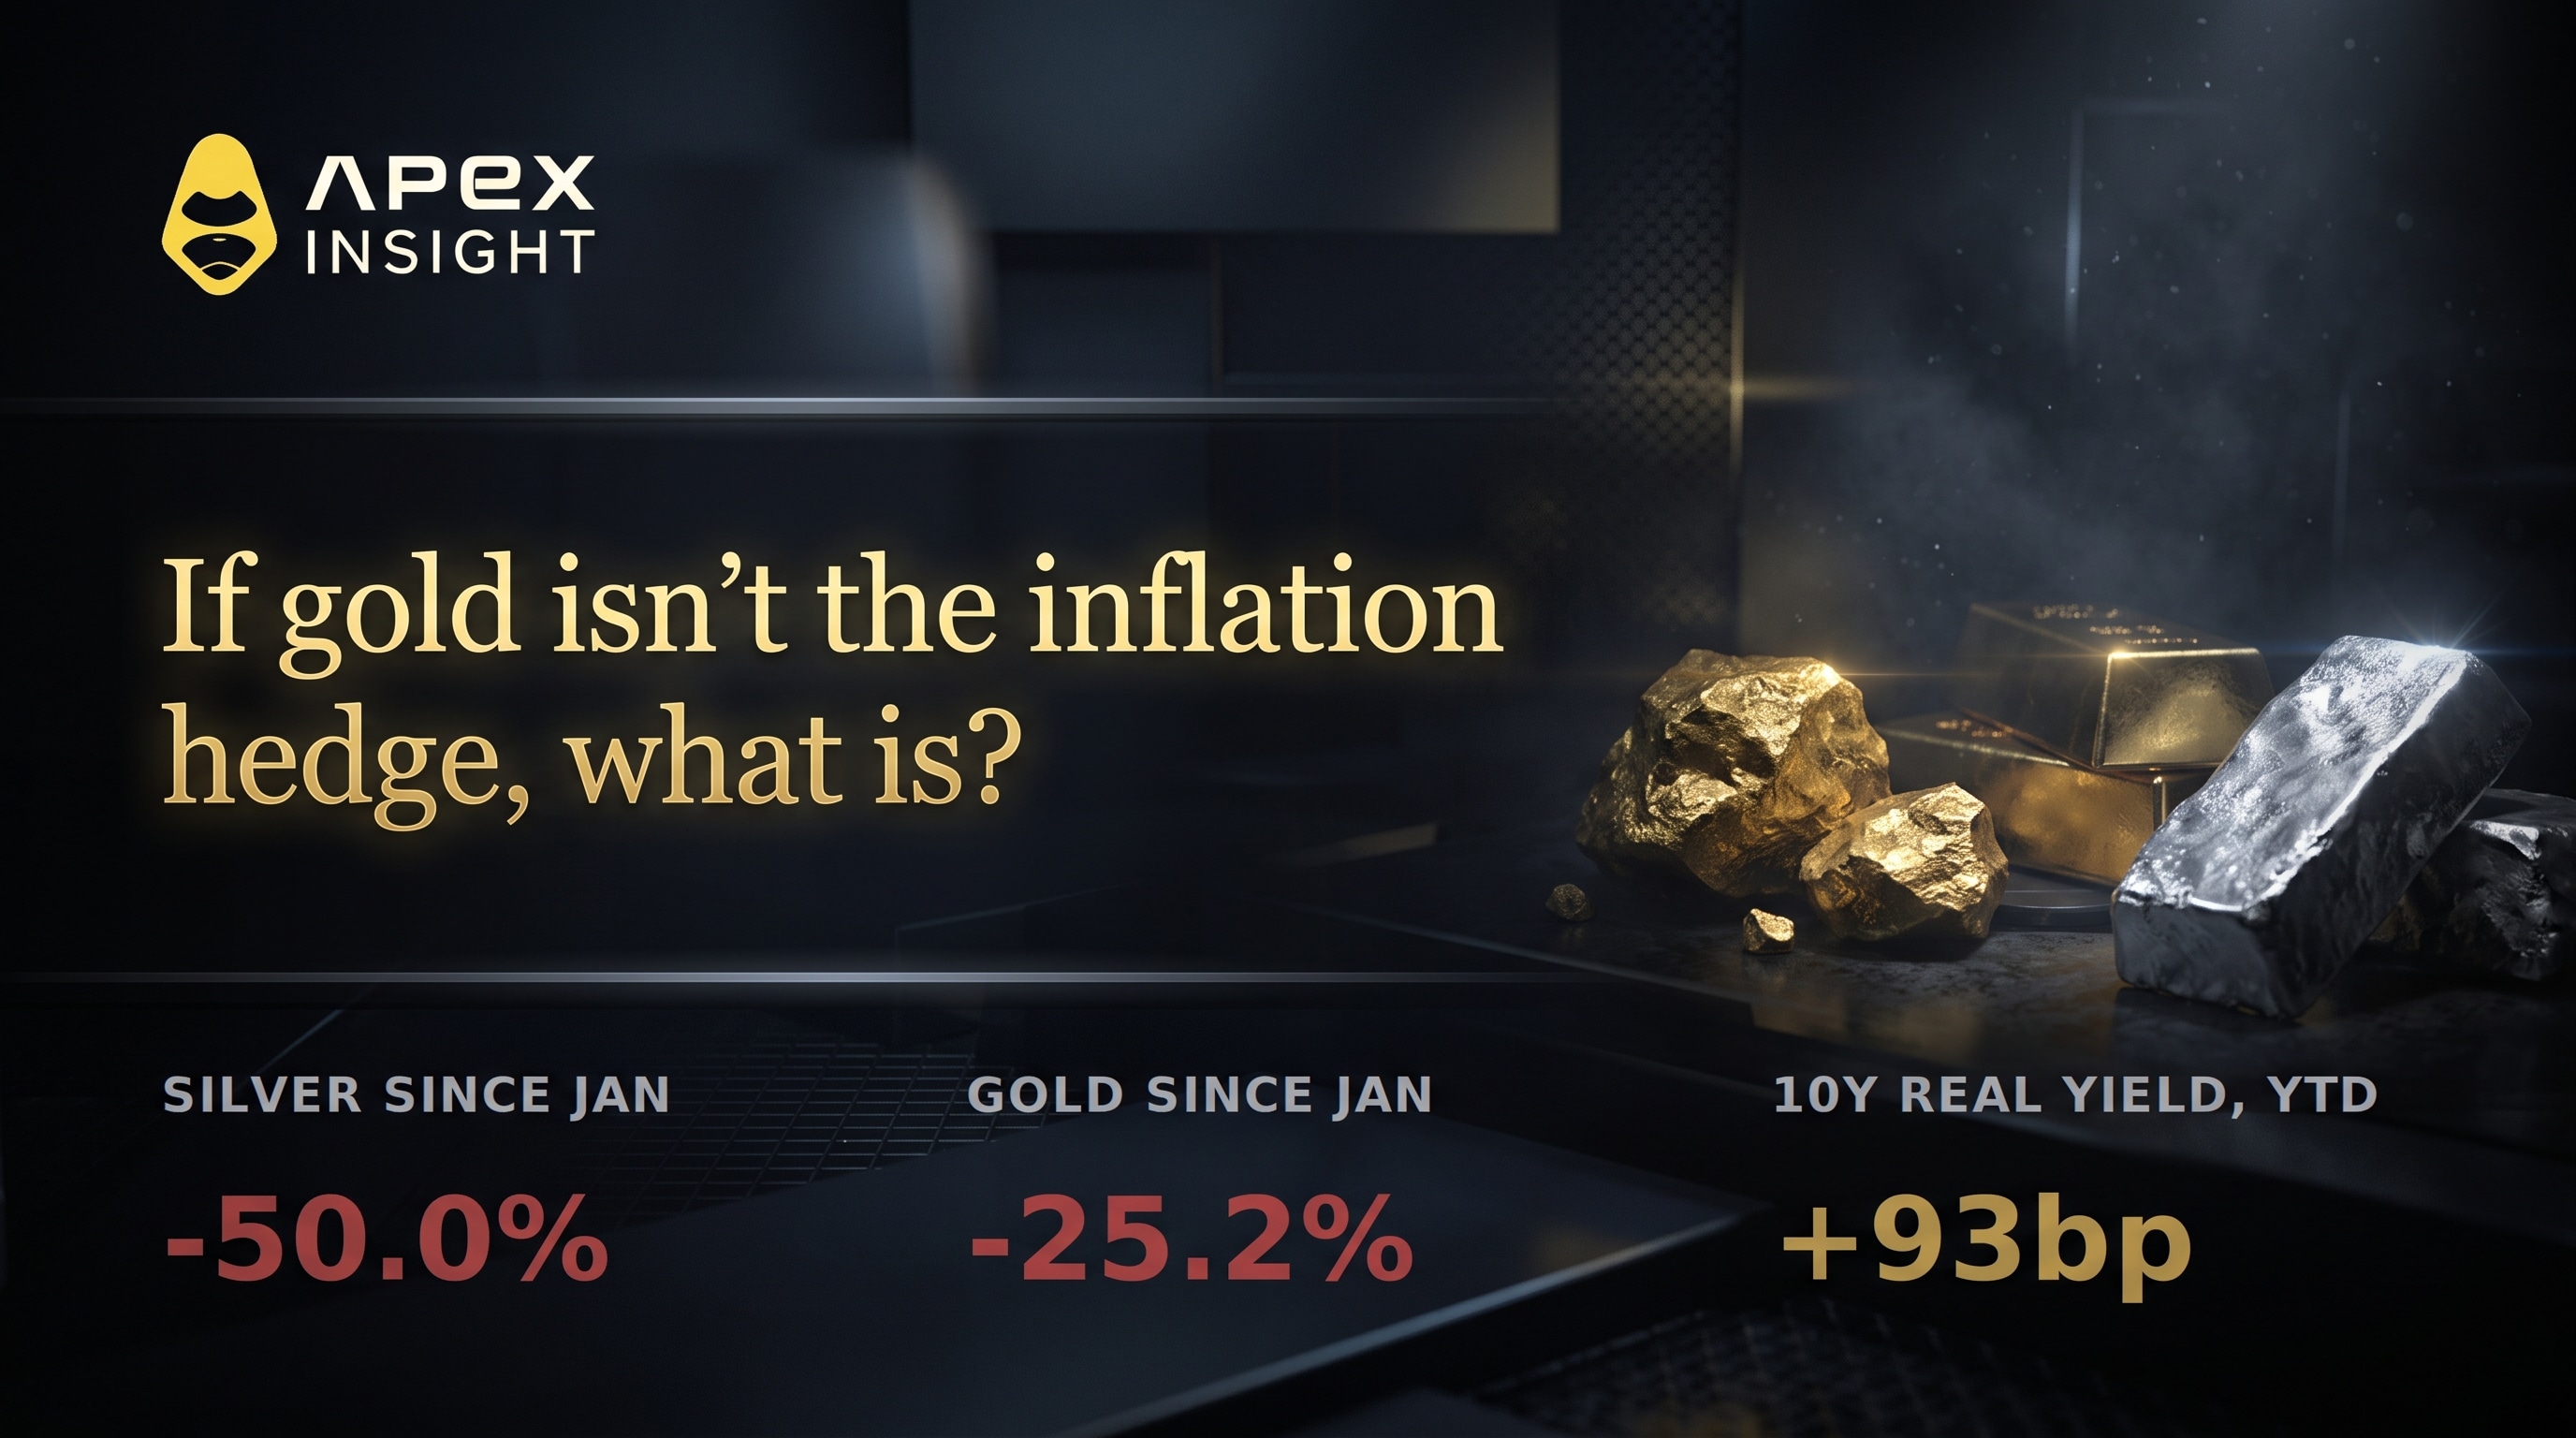


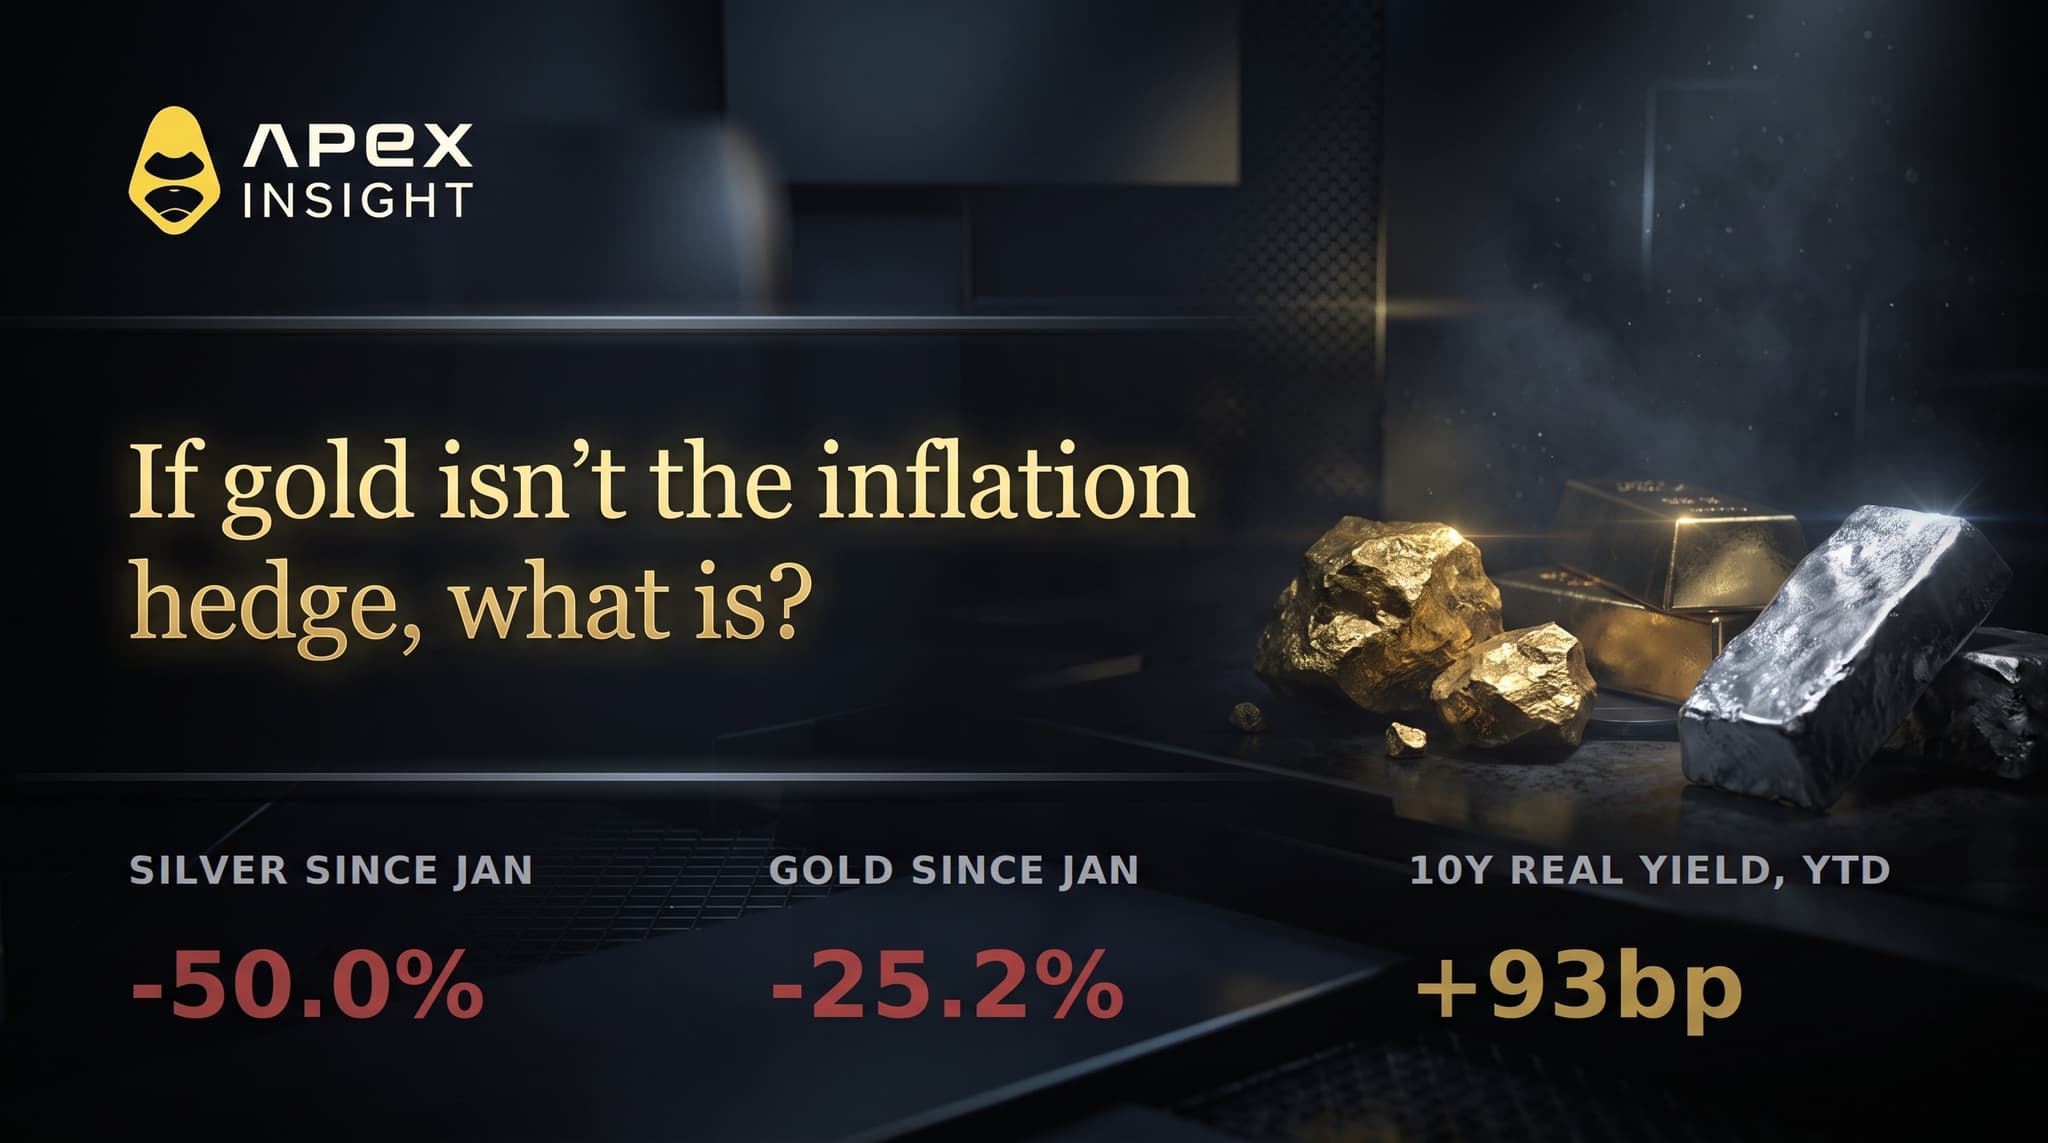



Here is the setup a commodities bull would have drawn up at the start of the year. Headline CPI running at 3.4% year on year. Energy prices up 16.3%, gasoline up 27.4%. Household one-year inflation expectations at 4.6%. A Federal Reserve so worried about prices that on 16 September it raised rates 25bp to 3.75-4.00% — unanimously, 12-0, its first hike since July 2023 — with roughly 80% of the market now pricing another one in December.
That is an inflation shock. It is the exact environment the monetary metals exist for.
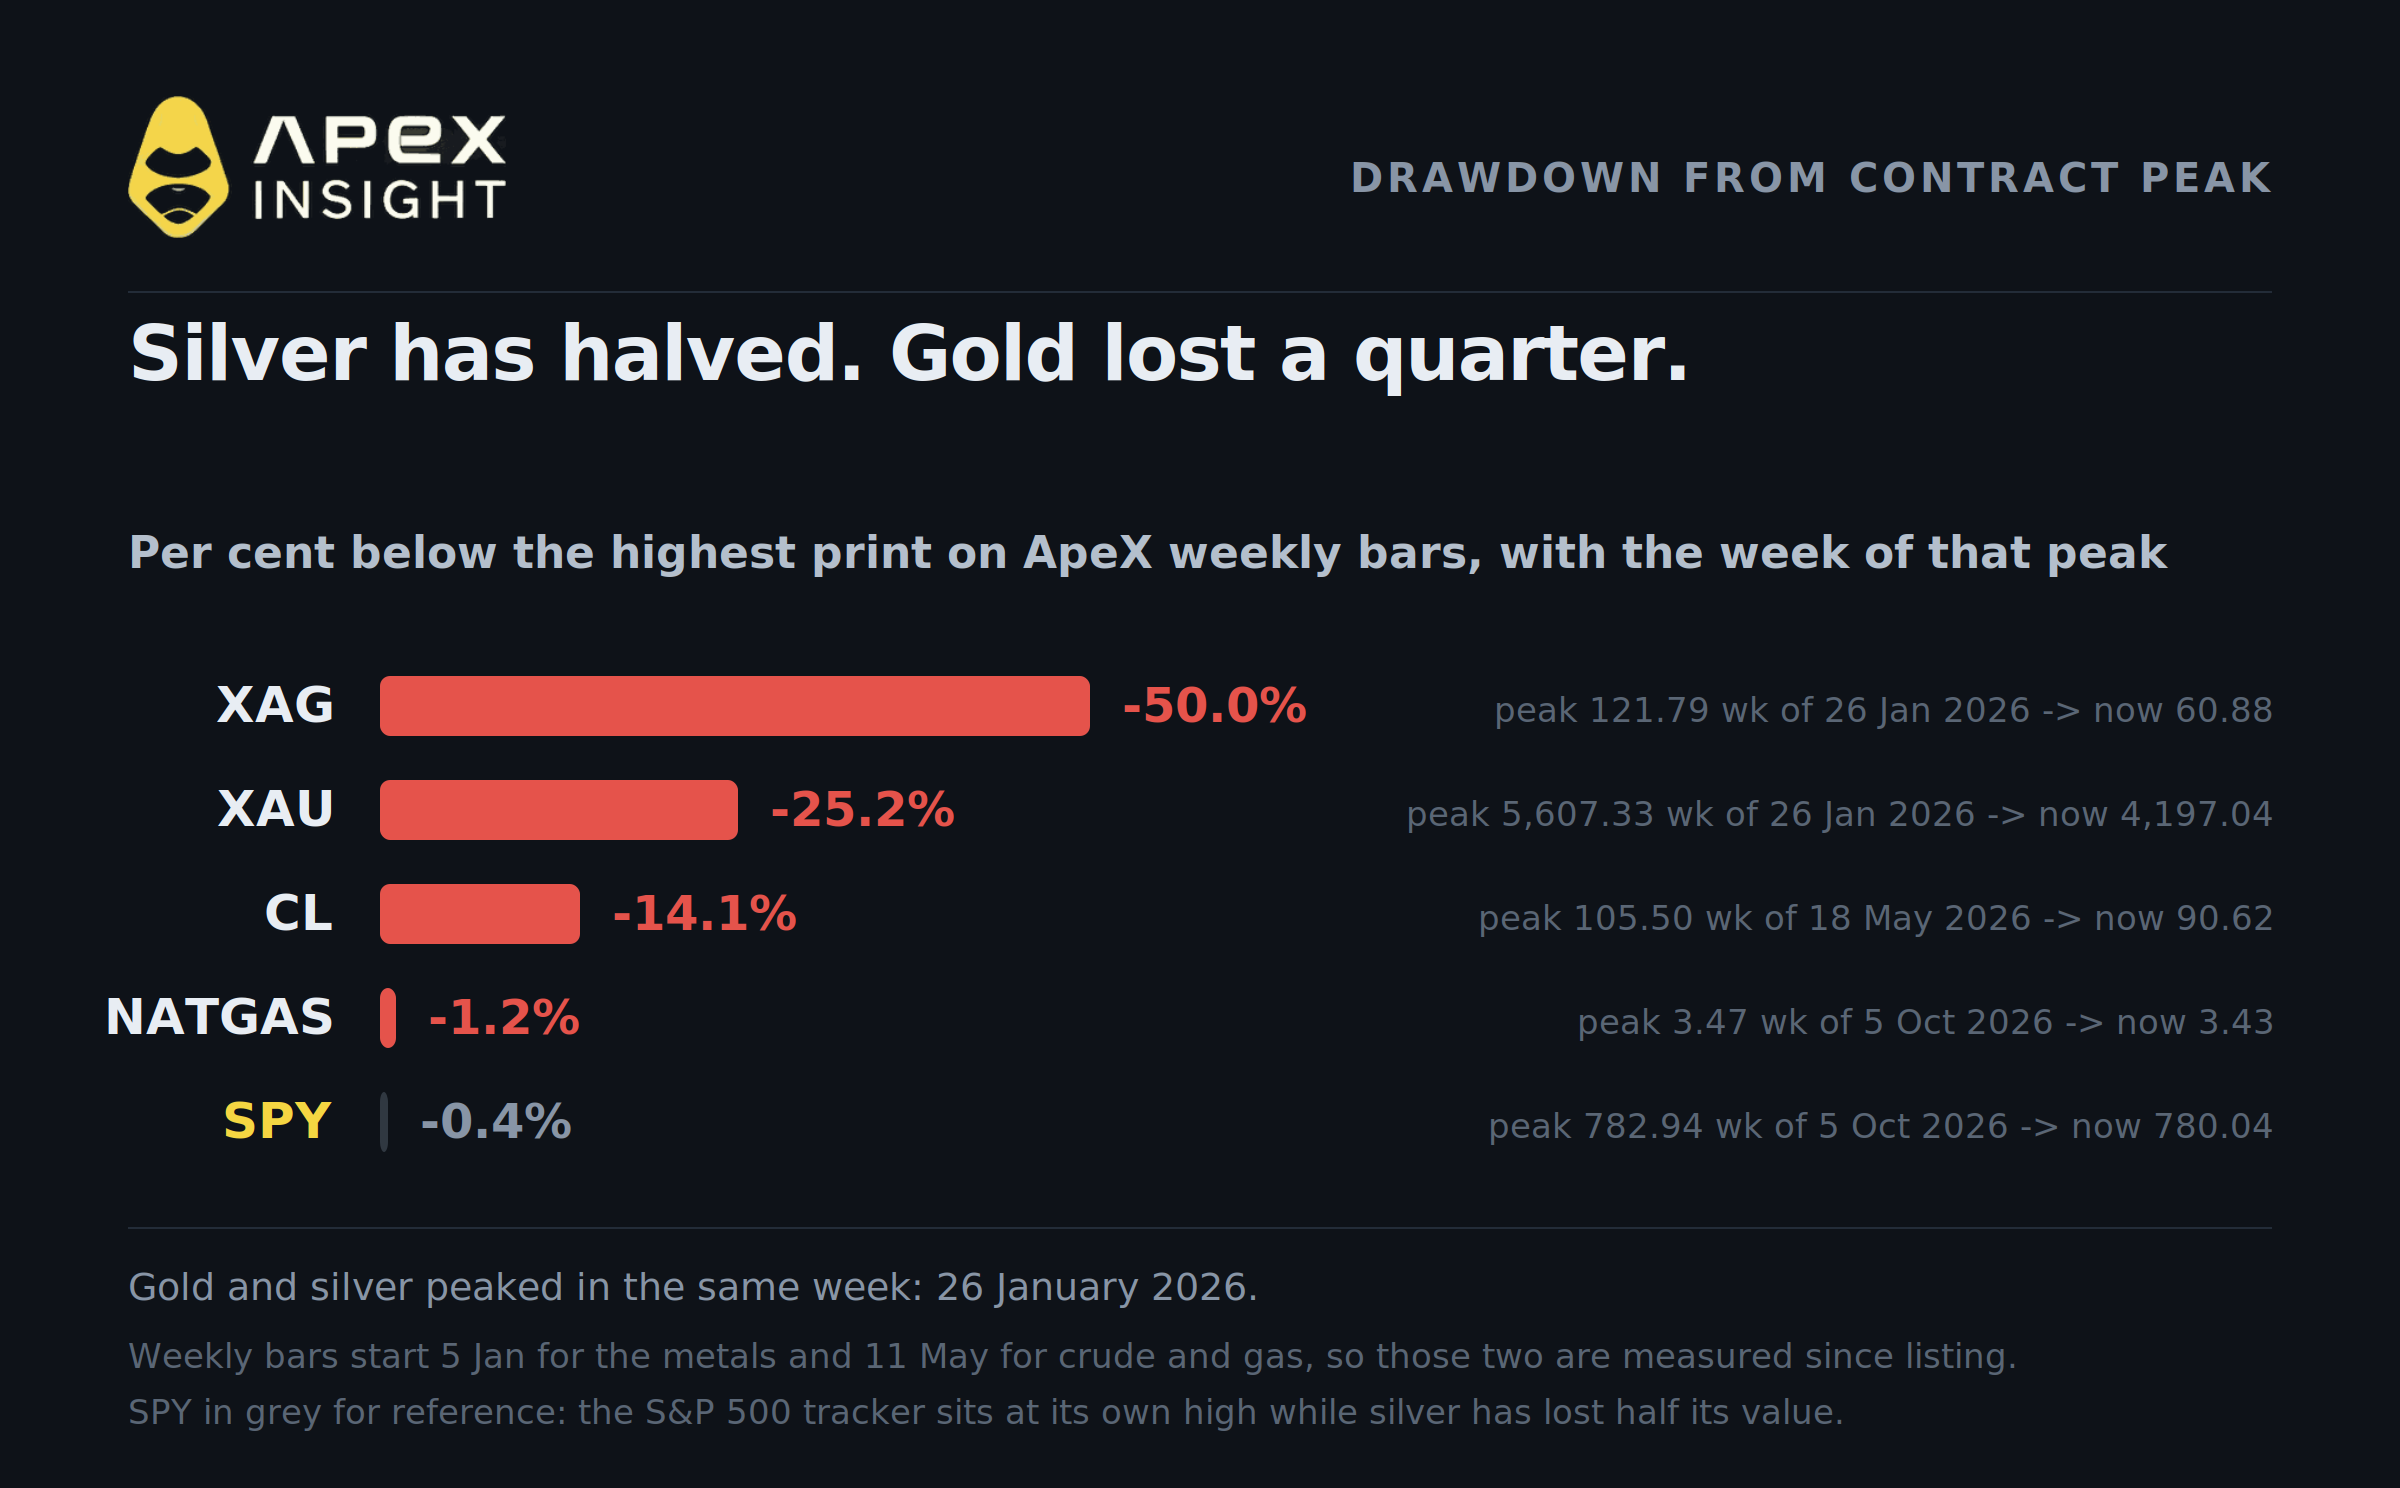
Measured on ApeX's own weekly tape as of 08:30 UTC on 10 October. Read the top two rows and the bottom two as different statistics: gold and silver run from January peaks, while crude and gas only have data since their 11 May listing — and natural gas's "peak" is this week's own high, so its −1.2% means "down from yesterday", not "down over nine months".
Contract | Peak | Week of | Now | From peak |
|---|---|---|---|---|
XAG | $121.79 | 26 Jan | $60.85 | −50.0% |
XAU | $5,607.33 | 26 Jan | $4,197.19 | −25.2% |
CL | $105.50 | 18 May | $90.74 | −14.1% |
NATGAS | $3.47 | 5 Oct | $3.43 | −1.2% |
Silver has halved. Not corrected, not consolidated — halved, from $121.79 to $60.88, in an inflation year. Gold has given up a quarter. If you have been reading that gold above $4,000 means gold is at a record, that is three-quarters of a year out of date.
Two separate things happened, and conflating them is how most of the commentary gets this wrong.
The first was a bubble. January was a monetary-debasement melt-up driven by fears over Fed independence, and it round-tripped in five sessions. Two-thirds of silver's eventual drawdown and three-fifths of gold's happened in the single week of 26 January — before the real interest rate had moved at all.
The second is the one still running. Since that crash the 10-year TIPS yield has carried both metals lower, rising from 1.94% at the start of 2026 to 2.87% — up 93 basis points, and touching 2.95% on 5 October, the highest in the series' history. Nominal yields went with it: the 10-year closed at 5.31% on 5 October, its highest since 2002, and traded as high as 5.35-5.36% intraday on the 7th, with the 30-year at 5.67%. Critically, 93 of the 103 basis points of this year's nominal move is real rate, not inflation expectations — breakevens contributed just 8bp. Gold pays no coupon, so when the risk-free real return rises by most of a point, the opportunity cost of holding it rises by exactly that much. High inflation does not help if the central bank is credibly fighting it.
Here is what each of the four is actually pricing, and which one is not playing the same game at all.
1. XAG — the squeeze that cured itself
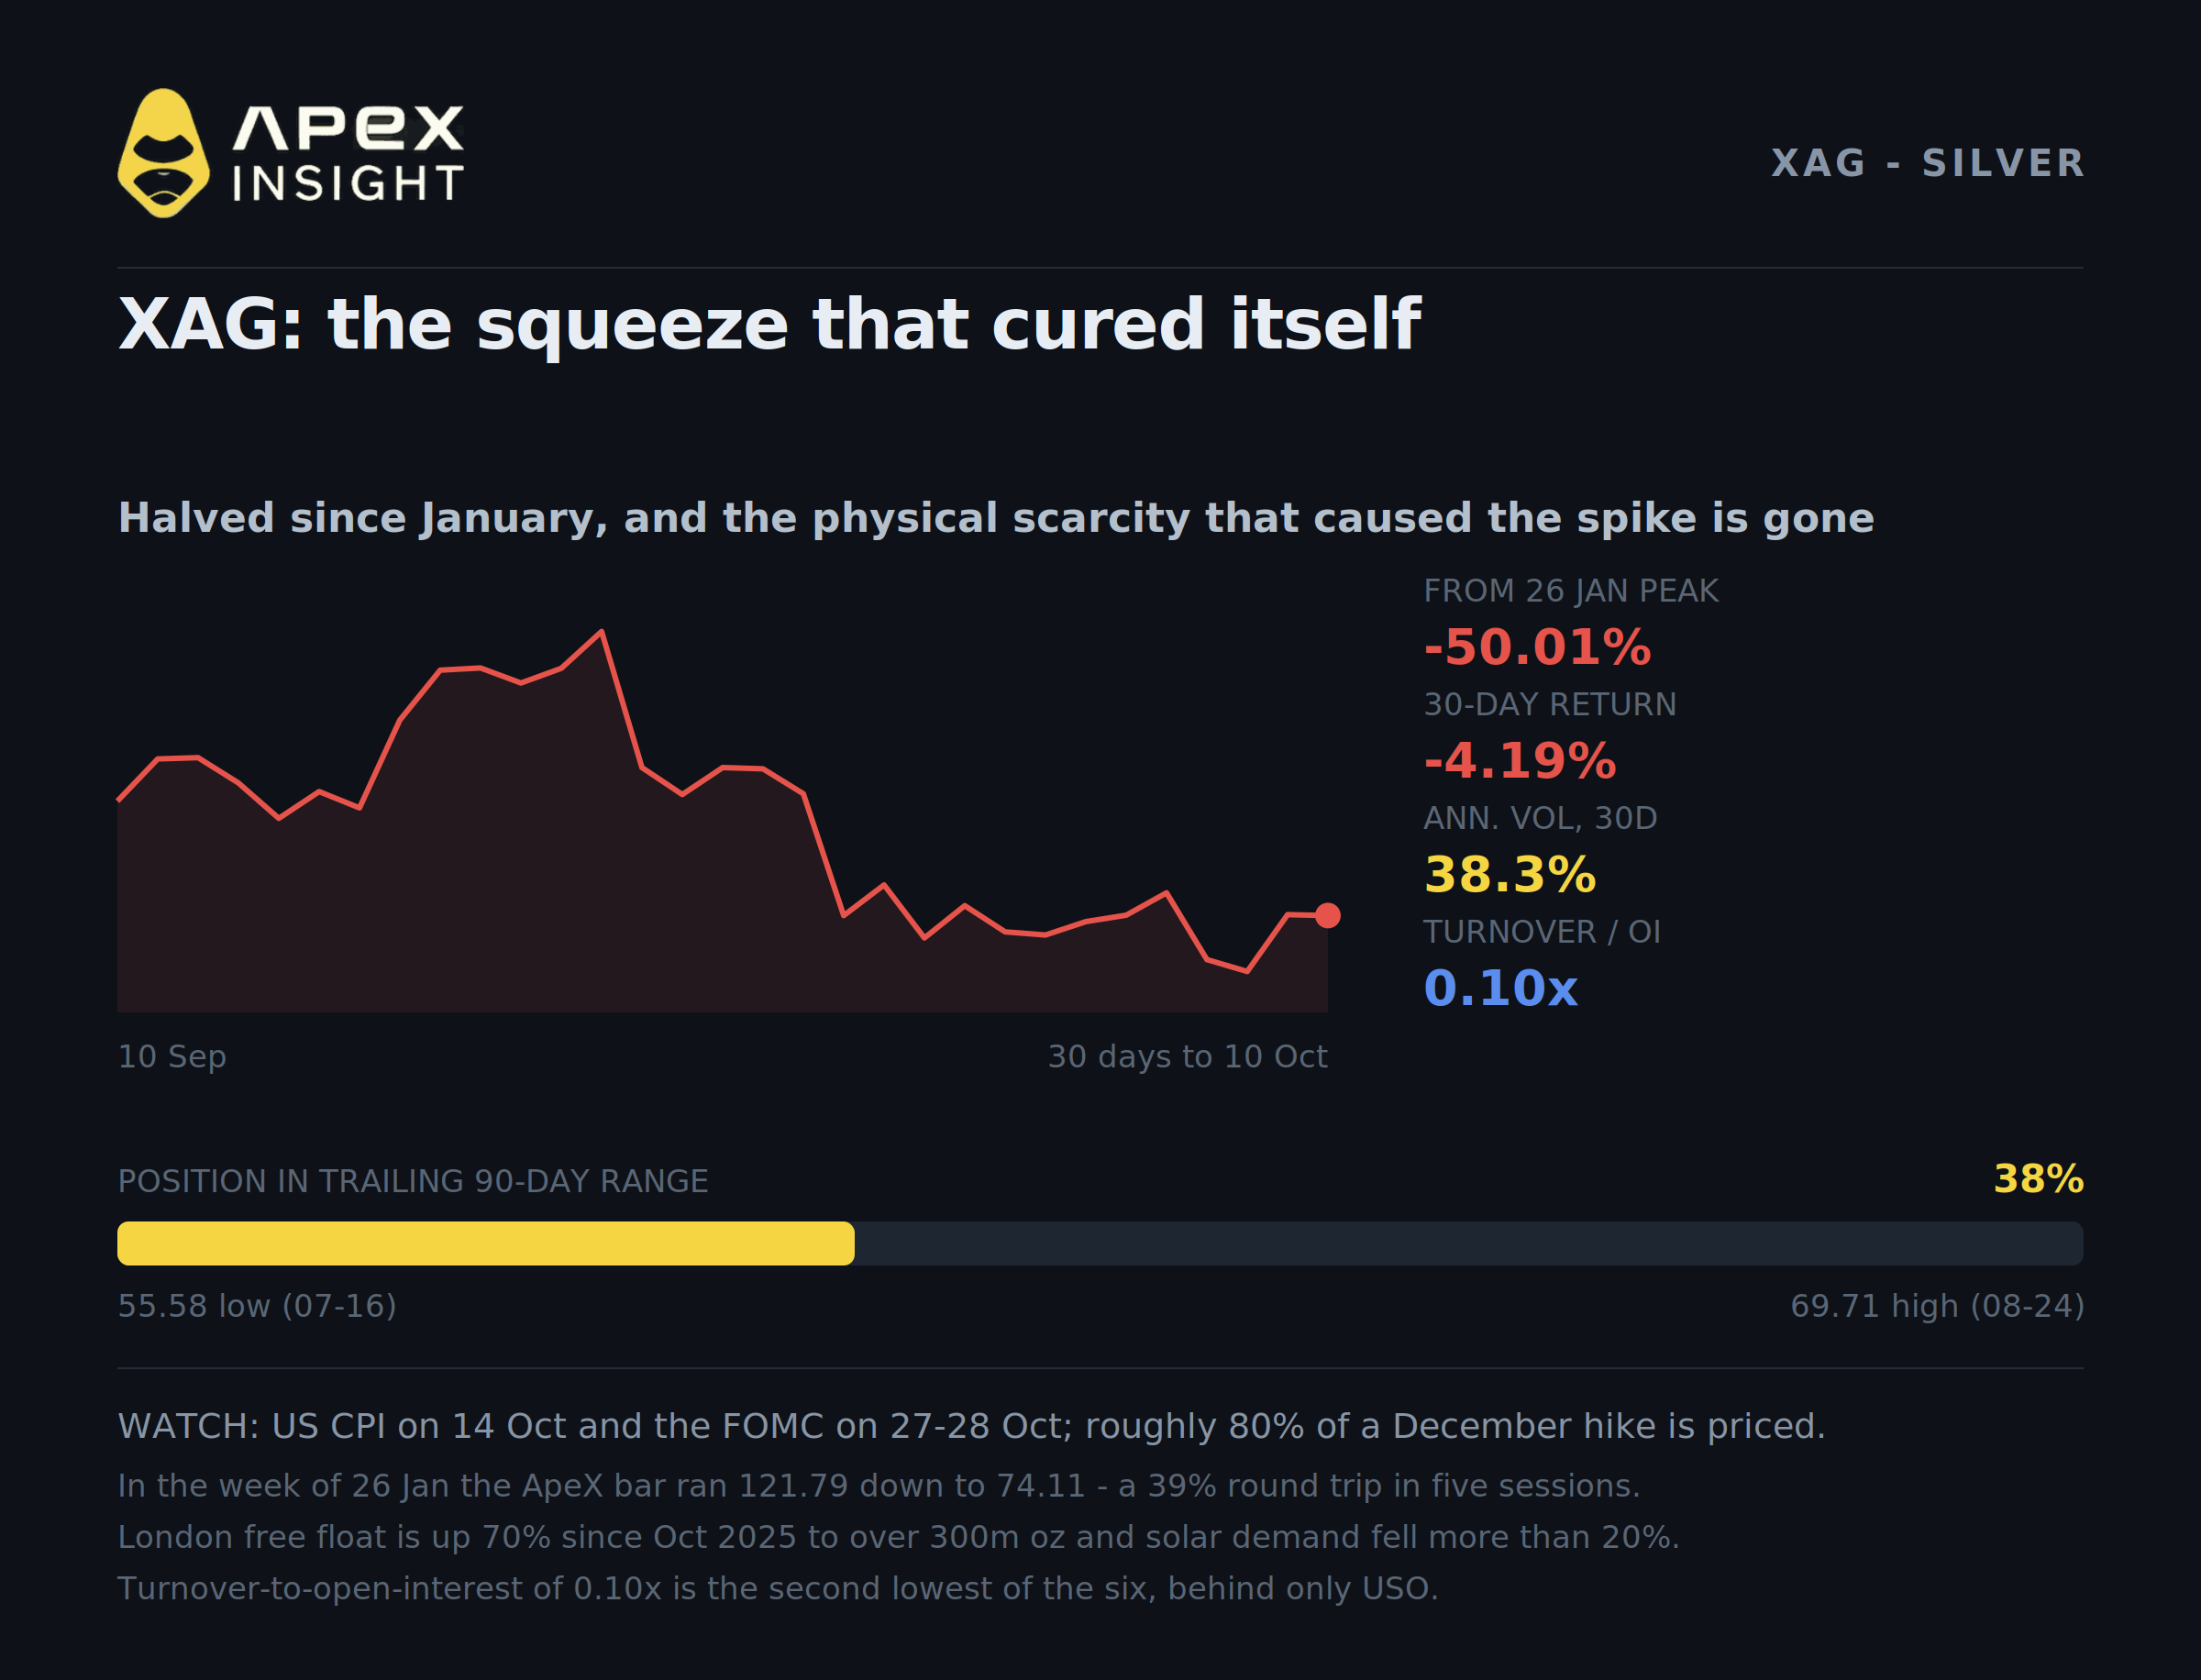
$60.85 · +0.94% on the day · 90-day range position 37.5% · 30-day annualised vol 38.3%
Silver's collapse happened in two acts, and the first one took a single week.
Act one: 26-30 January. ApeX's own weekly bar for that week tells the story better than any commentary — a high of $121.79, a low of $74.11, a close of $81.52. A 39% peak-to-trough move inside five sessions. Gold's bar for the same week ran $5,607.33 down to $4,687.54, a 16% round trip. In spot terms, 30 January saw gold close down 9.3% and silver close down 26.4% — silver's worst close since March 1980, after an intraday fall of about 36% that was the largest on record.
The trigger was not economic data. It was the nomination of Kevin Warsh to replace Powell as Fed Chair. The January melt-up had been a monetary-debasement trade, powered by fears over Fed independence; the moment the succession looked orderly and hawkish, the entire premium came out at once. CME had raised speculative silver margins in late January and lifted them again after the crash, and because margin is set as a percentage of a price that had tripled, the dollar call on leveraged longs had ballooned. Forced liquidation did the rest.
Warsh is now the sitting Chair. The man whose appointment killed the trade in January is running the hiking cycle that has kept it dead all year.
Act two: the physical story reversed. The January spike was built on genuine scarcity. That scarcity is gone:
London commercial vaults held over 914 million ounces at the end of August, with more than 300 million ounces freely available — a free float up 70% since October 2025. Shanghai Futures Exchange stocks have more than doubled since the end of 2025.
Solar demand fell 19%, from 186.6 to 151.0 million ounces, as manufacturers thrifted and substituted once silver passed $100. Deutsche Bank models a further 20% decline in 2026 solar use, down 33% in China, and the market flipping to surplus by 2027.
Recycling passed 200 million ounces for the first time since 2012, and total supply hit a decade high.
India raised the silver import duty to 15% in May and added licensing. Imports fell to 46.8 tonnes in May from 534.3 tonnes a year earlier. August recovered to roughly 15.5 million ounces, but the year is still running about 25% below 2025.
Deutsche Bank's Daniel Ghali puts it plainly: "Peak silver scarcity is clearly in the rear-view mirror." His house sees spot averaging $70 by Q2 2027; J.P. Morgan cut its 2027 silver average by 26%, to roughly $63.90.
The uncomfortable conclusion is that $121 silver destroyed the demand that justified $121 silver. The squeeze cured itself.
ApeX positioning: XAG shows 1,805 units of open interest, about $110,000 of notional, against just $10,896 of 24-hour turnover — a turnover-to-open-interest ratio of 0.10x, the second lowest of the six commodity contracts on the venue behind only USO at 0.06x. Whoever is in this one is sitting still. Note the book is small in absolute terms, so read it as texture rather than signal.
2. XAU — everything the bulls wanted, and it still fell
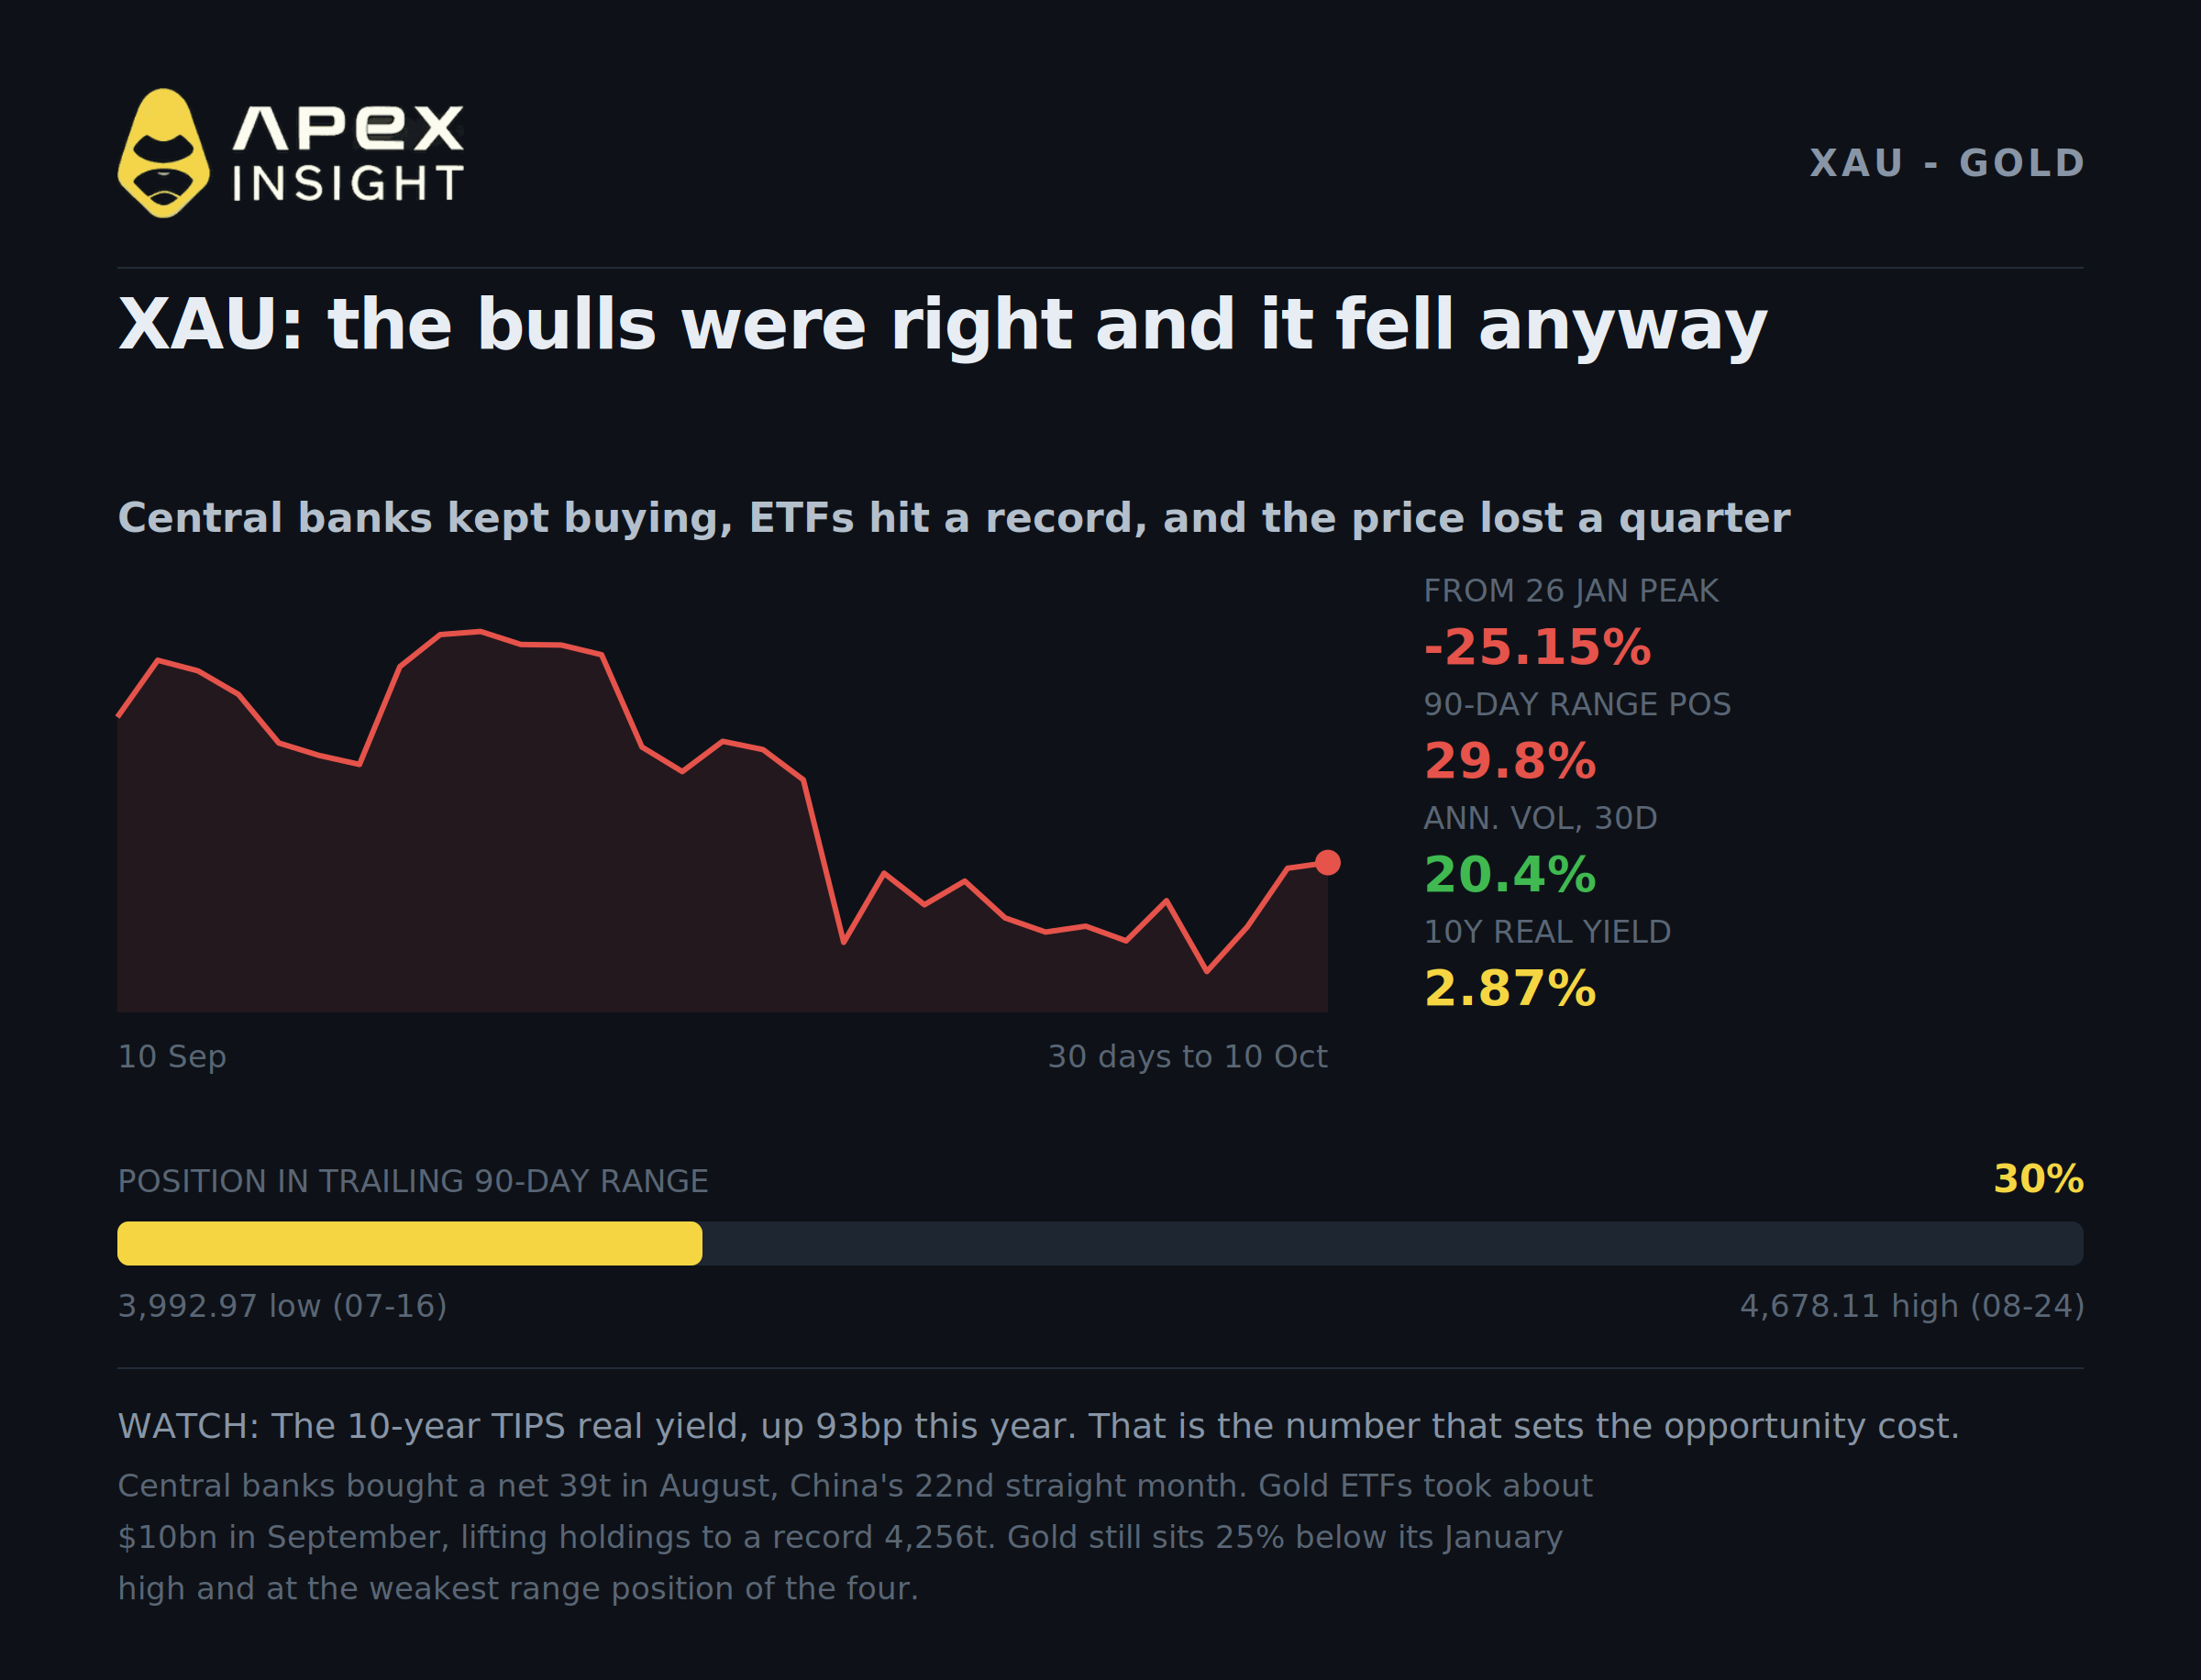
$4,197.19 · +0.14% on the day · 90-day range position 29.8% · 30-day annualised vol 20.4%
Gold's case is more interesting than silver's, because the bullish arguments were all correct and none of them worked.
Central banks never stopped buying. August was a net +39 tonnes, with China adding 20 tonnes in its 22nd consecutive month of purchases, alongside Poland, Uzbekistan, Kazakhstan, Turkey and the Czech National Bank. Poland has bought 98 tonnes year to date and China 80. The composition has shifted — Turkey and Russia have been net sellers of 82 and 56 tonnes respectively — but the official-sector bid is intact.
ETF demand came back hard. September saw roughly $10bn of net inflows into gold-backed ETFs, lifting global holdings 67 tonnes to a record 4,256 tonnes, with North America, Europe and Asia all contributing. That is not a liquidation.
And the price still fell 25% from its January high, including a slide below $4,100 on 7 October, its first since early August. Gold is at 29.8% of its trailing 90-day range, the weakest position of the four contracts here.
So the structural bid held and lost anyway. That rules out central banks and ETFs as the marginal price-setter, but it does not by itself name the replacement. The decomposition does: 93 of the 103 basis points of this year's nominal yield move is real rate, with breakevens adding only 8bp. This is a real-rate shock, not an inflation-expectations story, which is precisely why a 3.4% CPI print has not rescued the metal. Morgan Stanley's Amy Gower frames it as gold having to compete with high yields for portfolio share — "challenging," in her words, for an asset that yields nothing. Gold fell 8.5% in September in the same month ETFs added a record 67 tonnes.
The strongest counter comes from Pepperstone's Chris Weston, who argues gold could decouple if the long end starts being read as sovereign credit risk rather than policy tightness — a 30-year at 5.67% against a large and heavily long-dated deficit and heavy long-dated issuance is at least as much a fiscal statement as a monetary one. That is the bull case worth watching, and it is a bet on why yields are rising rather than on whether they do.
Positioning is sparse: 33 units of open interest, about $137,000 notional, against $196,998 of turnover — a 1.44x turnover ratio, the most actively churned of the four relative to what is held.
What to watch: US CPI on 14 October, and the FOMC on 27-28 October. Markets have largely priced October out and December in, so the hawkish risk is a surprise at the October meeting.
3. CL — crude is a rates instrument now
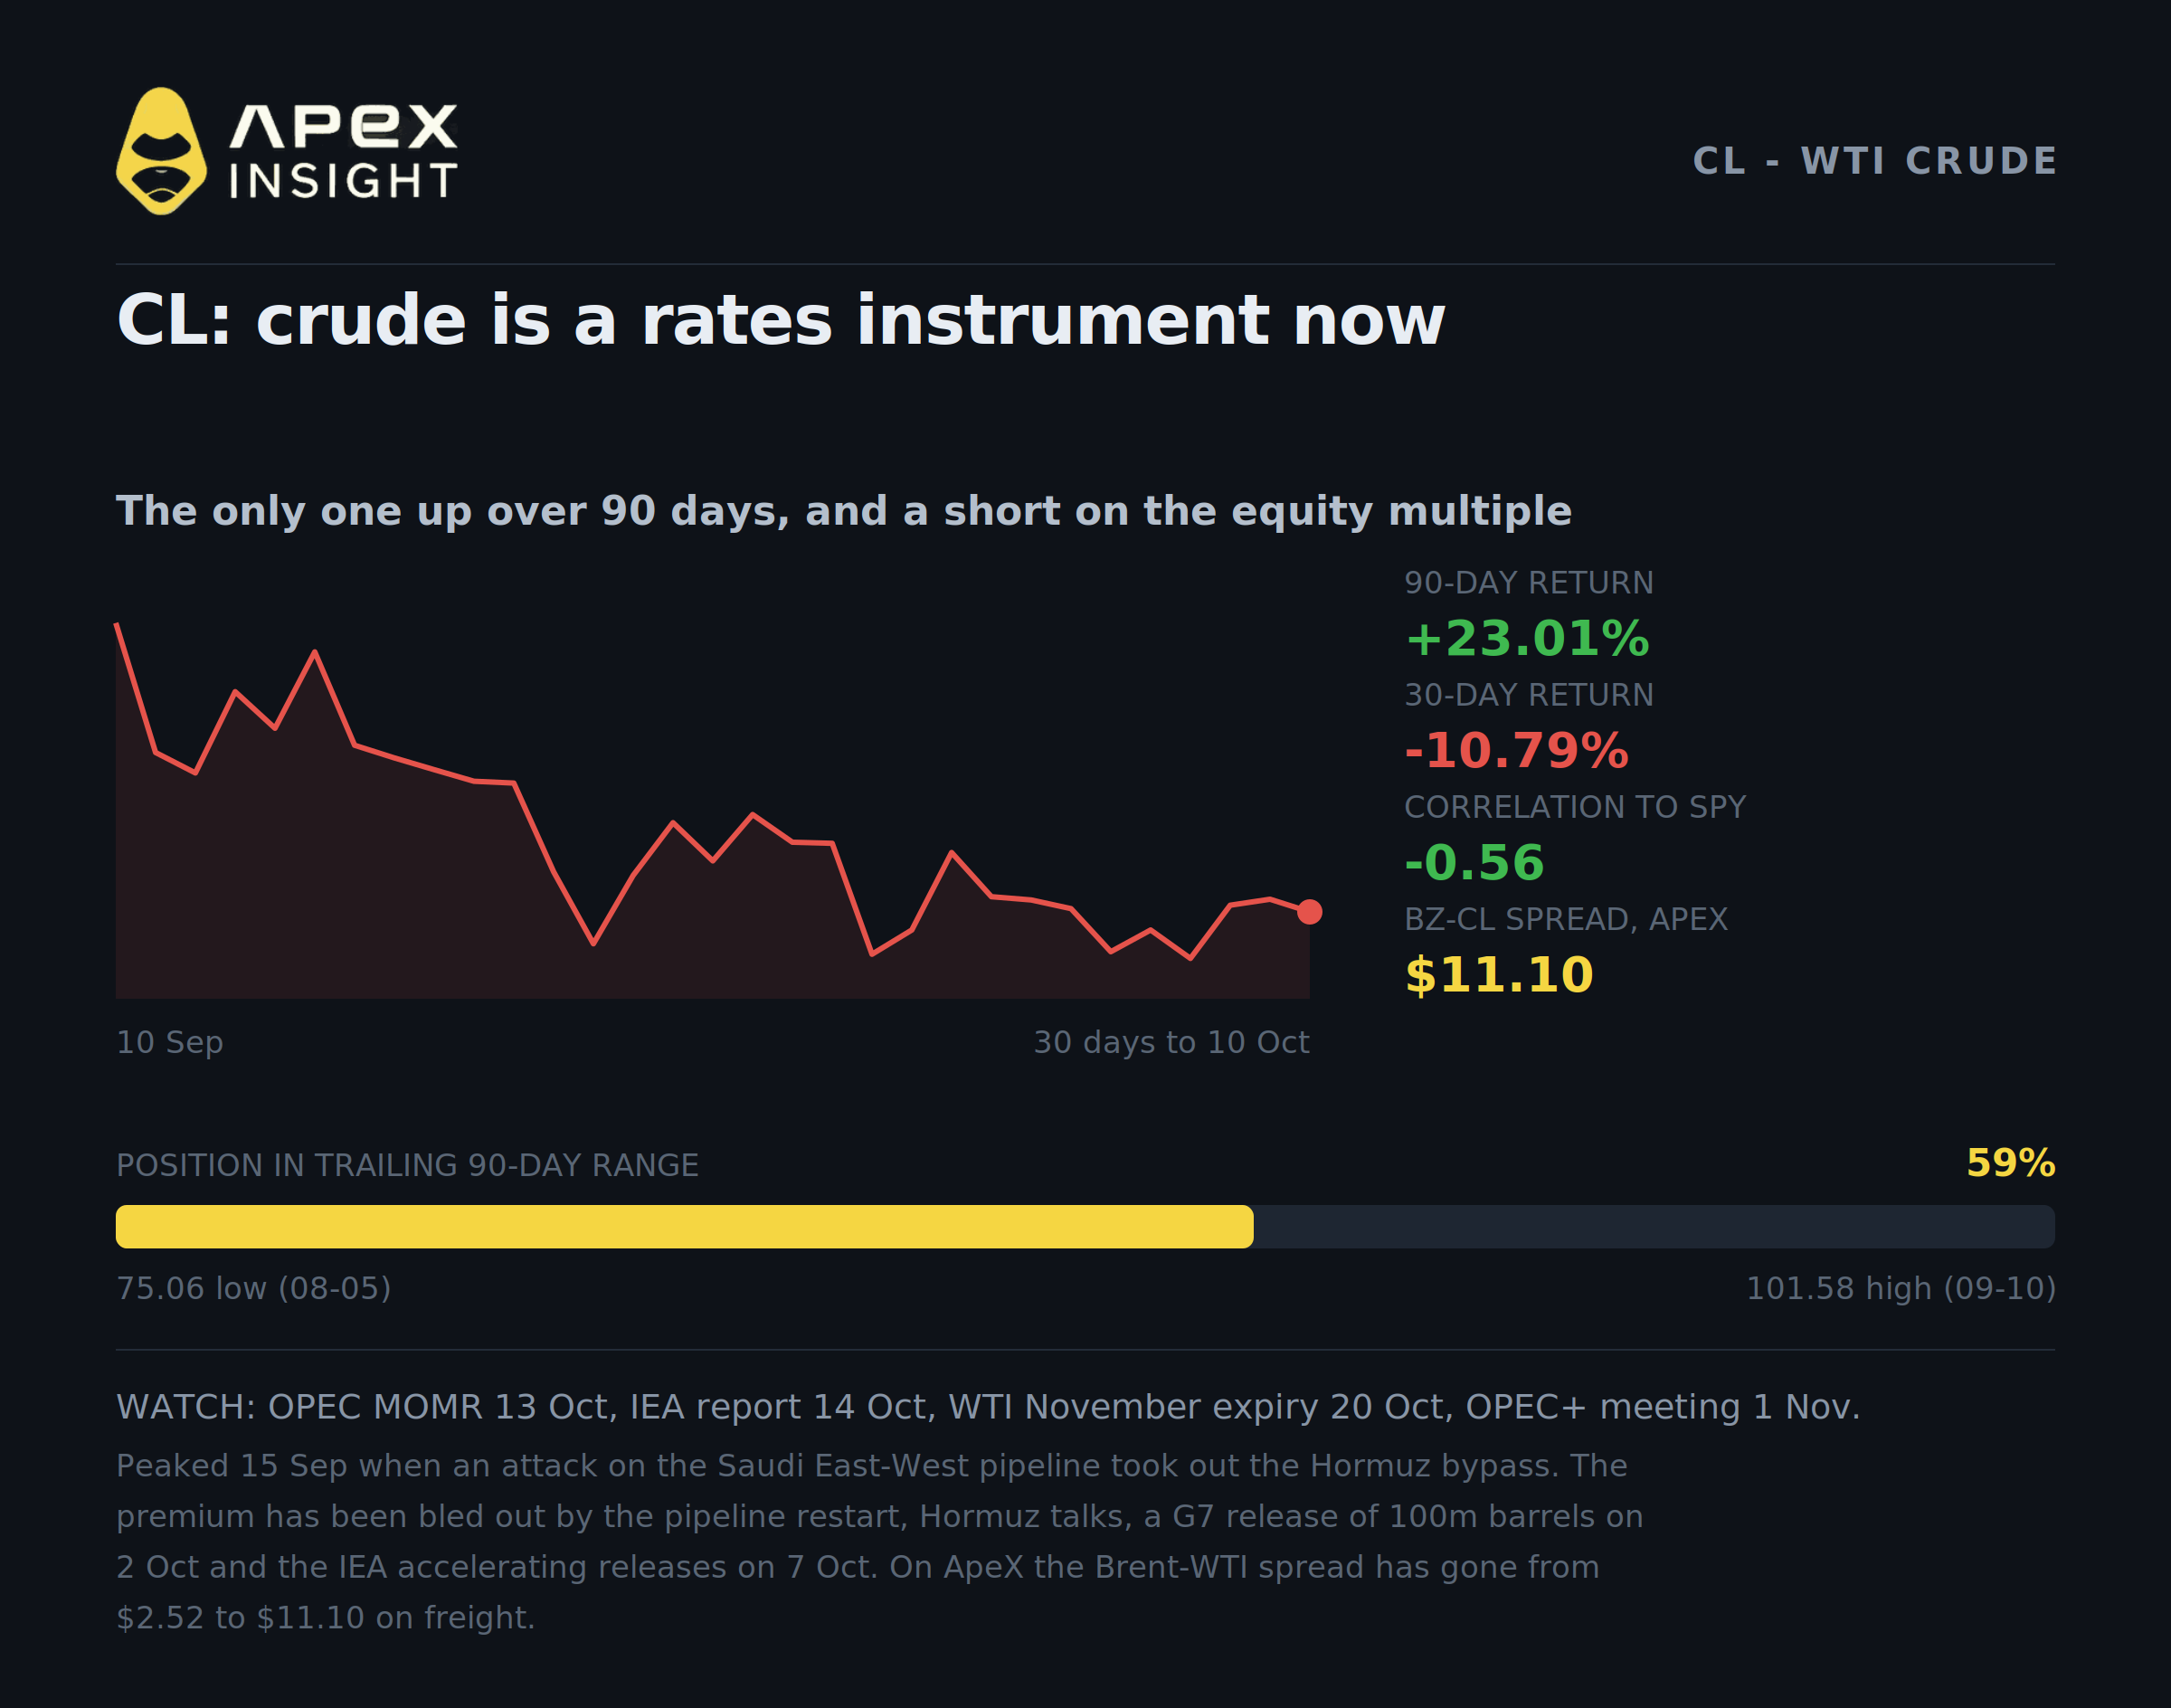
$90.74 · +0.58% on the day · 90-day return +23.0% · 30-day return −10.8%
Crude is the only one of the four that has made anyone money over a quarter, and the only one whose chart is about war rather than monetary policy.
The up-leg was a genuine supply crisis. Middle East shut-ins averaged 4.8 mb/d in September, down from a peak of 10.9 mb/d in May. Saudi output fell to 6.238 mb/d in August, its lowest since 1990. The peak came on 15 September, when an attack on Saudi Arabia's East-West pipeline took out the main bypass around the Strait of Hormuz: Brent futures touched $109 and physical Dated Brent printed as high as $131-132 — a distinction worth keeping straight, because the spot and futures markets dislocated badly. The IEA has called this the worst oil supply crisis on record.
Since then the premium has been bled out by policy, in four dated steps:
Date | Event |
|---|---|
22 Sep | East-West pipeline partly resumes flows |
25 Sep | US and Iranian negotiators discuss reopening Hormuz |
2 Oct | G7 announces a release of 100 million barrels over four months |
7 Oct | IEA members agree to accelerate stock releases and prioritise diesel |
Roughly 325 million barrels have already been released, with about 100 million more to come and some 1.1 billion barrels of public emergency stocks remaining. The US SPR is down to about 283.8 million barrels, its lowest since 1982. OPEC+ left November targets unchanged on 4 October and next meets on 1 November.
The cross-asset fact is the one worth trading. Over the last 60 weekday sessions, crude's daily returns correlate −0.56 with the S&P 500 and −0.50 with the Nasdaq 100. That is not a growth scare; it is the inflation channel running in reverse. Crude is the marginal input to a CPI print that is driving a hiking Fed, so higher oil means higher breakevens, higher yields and lower multiples — and lower oil means relief. The S&P set records on 5-6 October on the days WTI was falling, and sold off on 8 October when WTI jumped $4.20. For the moment, buying crude is a short on the equity multiple. Call that a live correlation rather than a hedge: it is one 60-session window spanning exactly one regime, on an instrument carrying five times the S&P's volatility, and Brent is actually the better expression at −0.62. A useful sign, not portfolio insurance.
One trade the data points at directly: on ApeX's own contracts the Brent-WTI spread has blown out from $2.52 on 15 September to about $11.10, far beyond the $8-10 that B. Riley's Art Hogan describes as typical. In the physical market the gap is wider still, quoted around $13-15 in early October. The mechanism is freight — because Brent is priced on waterborne delivery, longer routes and record tanker rates inflate it directly, and Hurricane Isaias has simultaneously shut in about 1.28 mb/d, or 62.9%, of US Gulf of Mexico output while threatening the Gulf Coast refineries that buy WTI. Standard Chartered's Emily Ashford called it the widest since early May. The EIA's own 4Q26 forecast assumes about $8.00, with Brent at $105 and WTI at $97.
Worth knowing even if you only trade the flat price: diesel, not crude, is the tightest thing in energy. The 3-2-1 crack averaged its highest monthly level since June 2006 in August, US distillate stocks sit 12% below the five-year average, and the IEA is now explicitly prioritising diesel in emergency releases.
4. NATGAS — the only one that is not trading the Fed
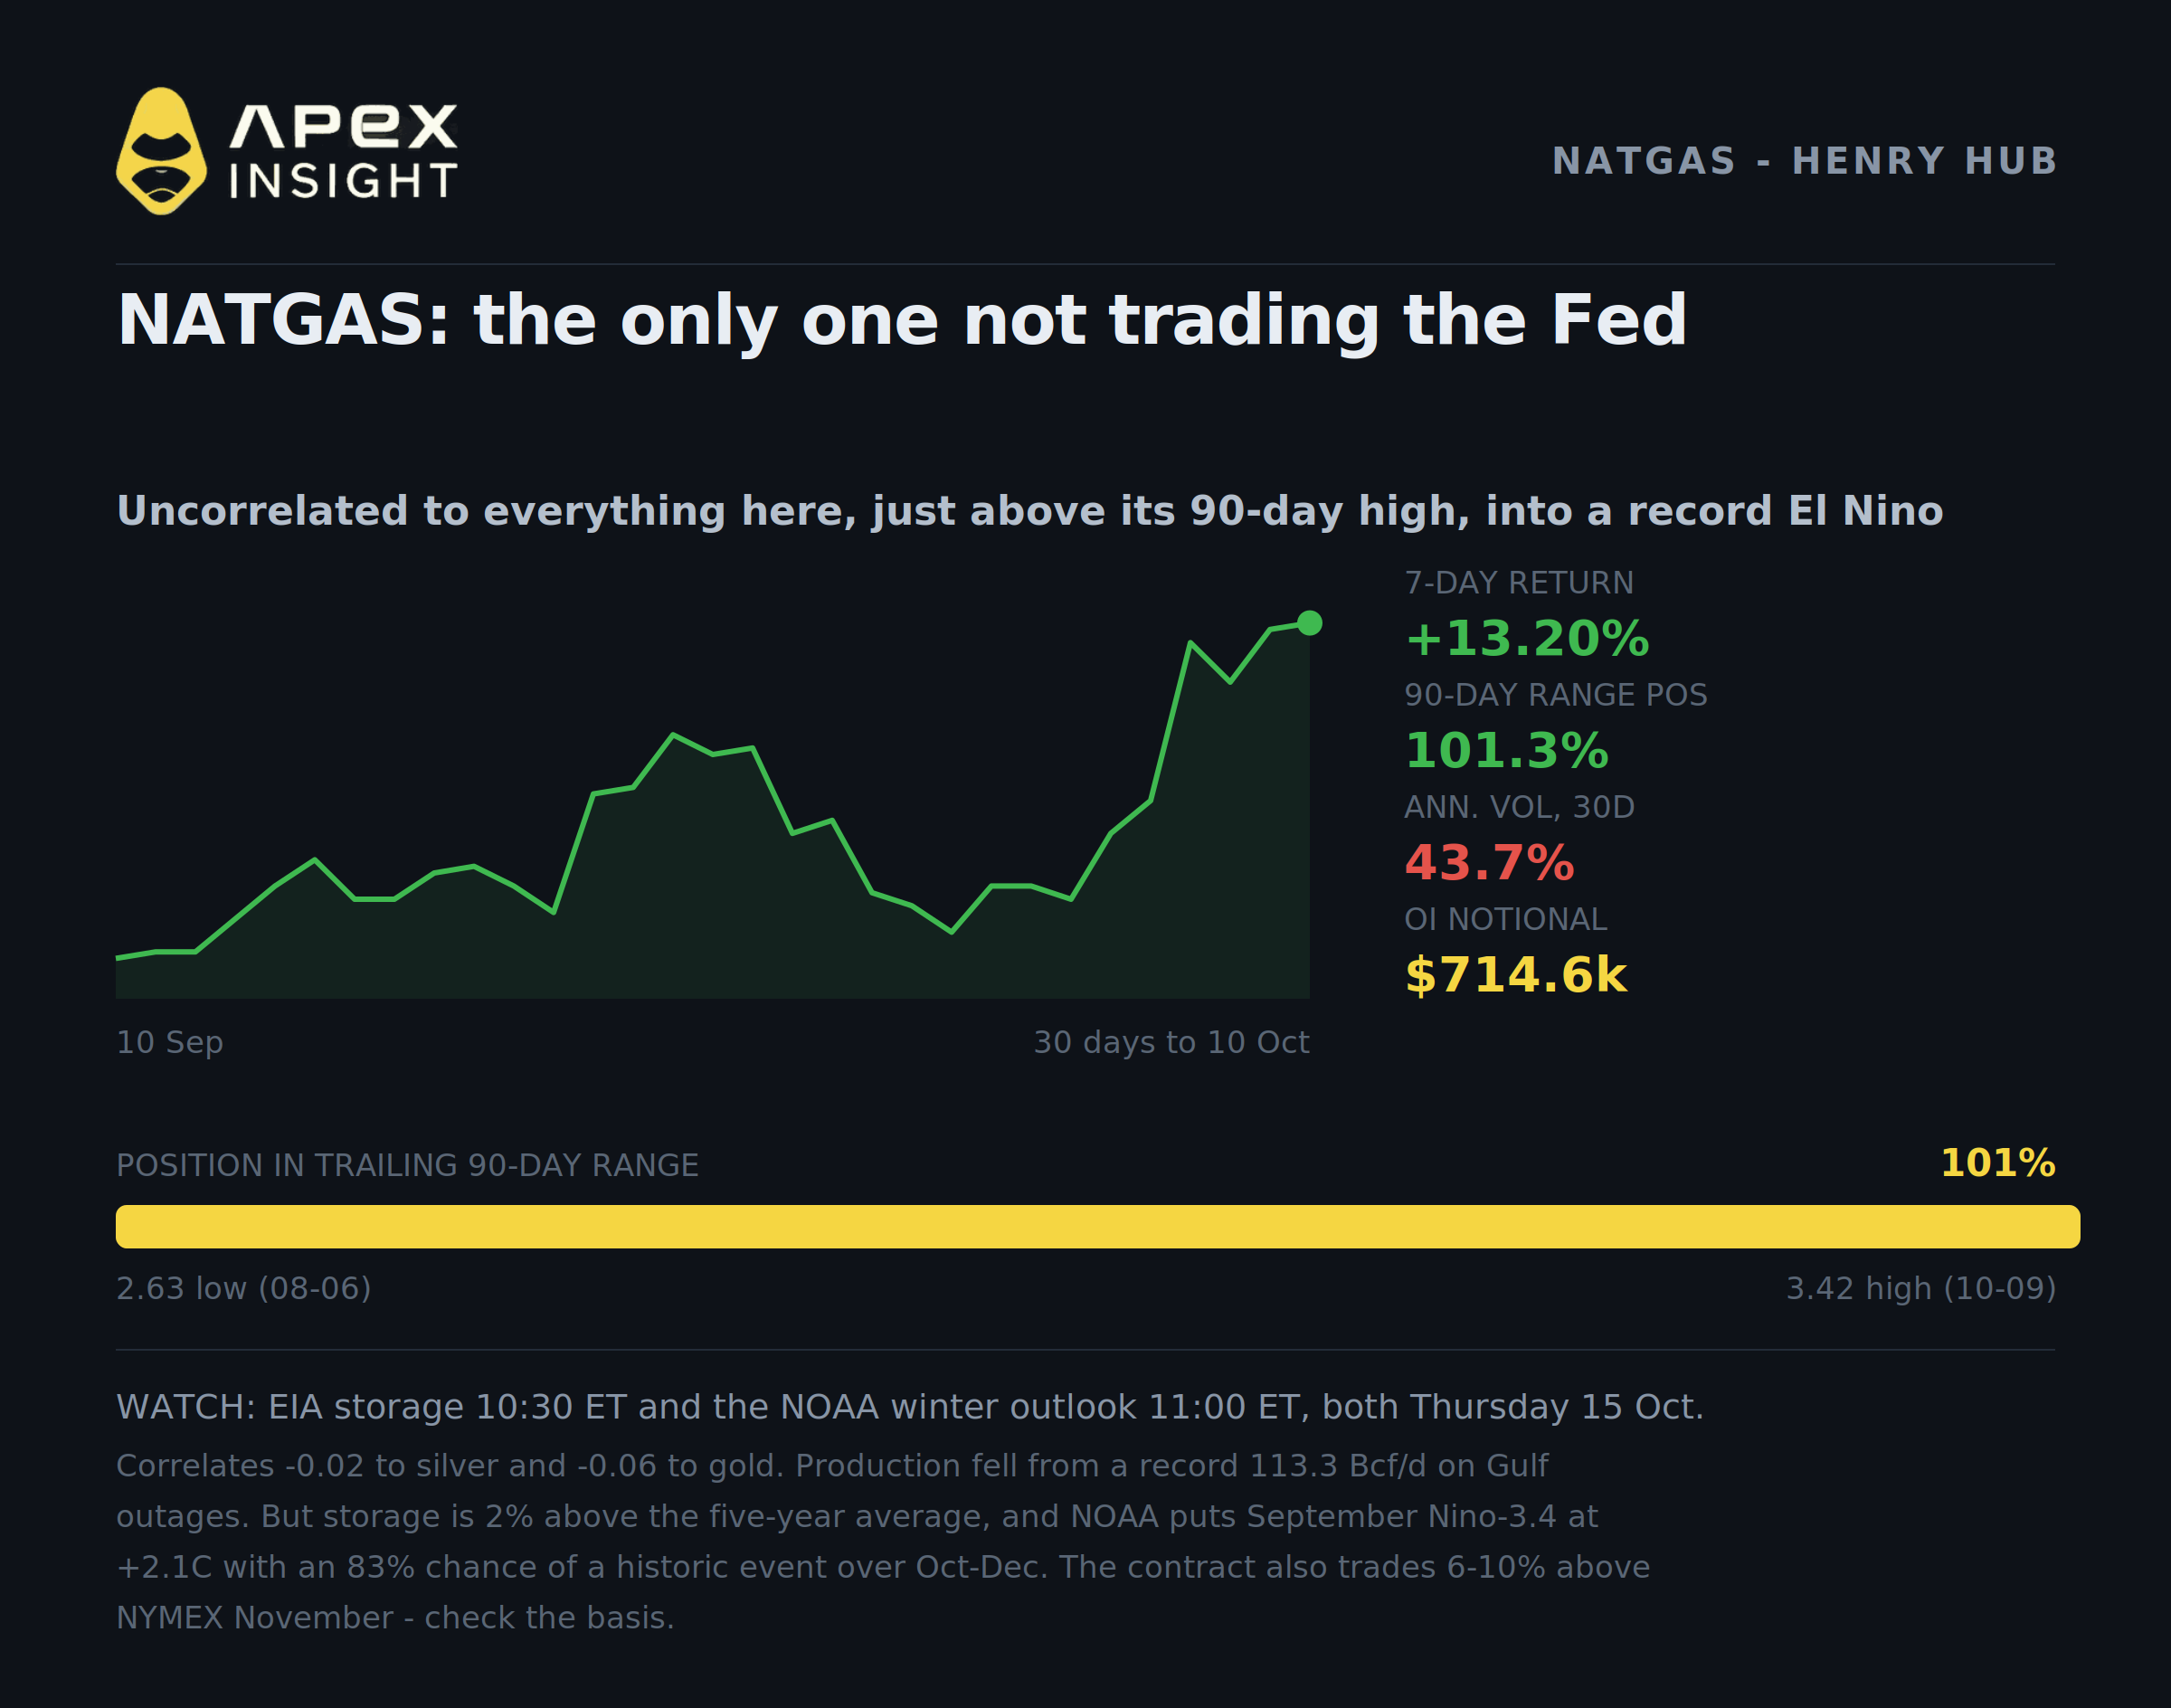
$3.43 · +3.63% on the day · +13.2% over seven days · 208,330 units of open interest
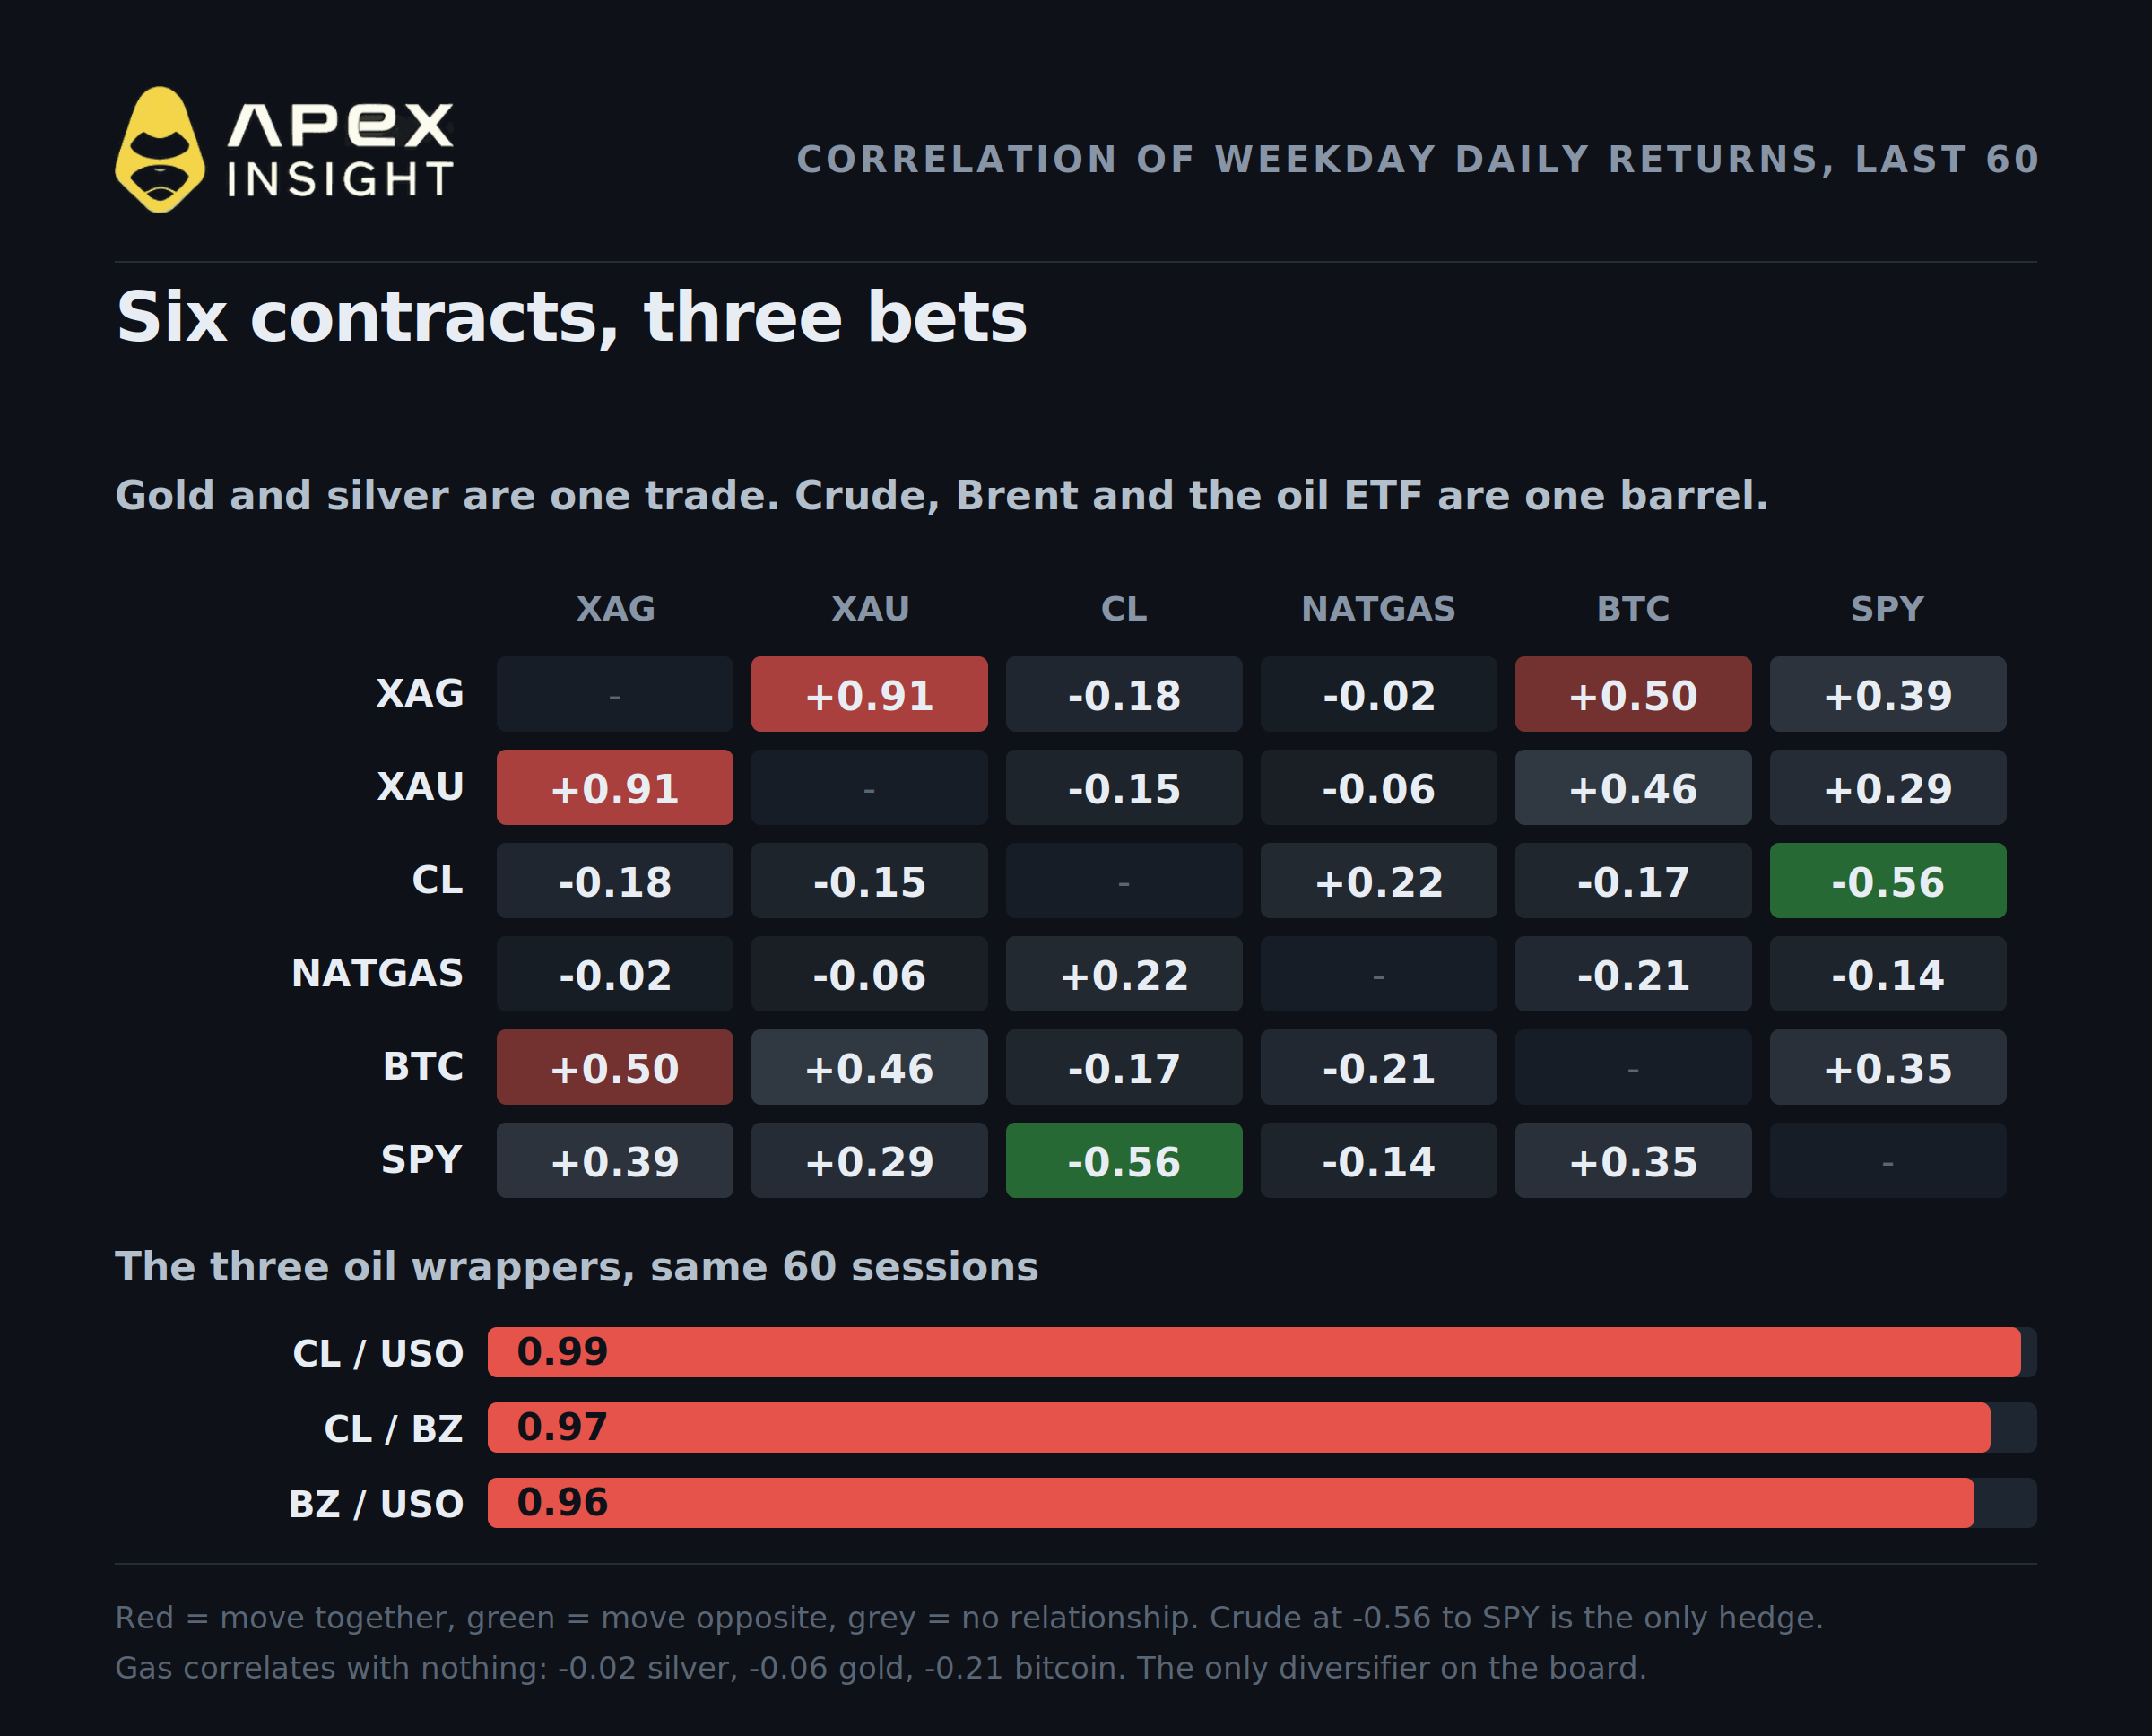
Natural gas is the single uncorrelated asset in this set, and it is not close. Against silver it runs −0.02. Against gold −0.06. Against bitcoin −0.21, the S&P −0.14, the Nasdaq −0.10. Only crude shows any relationship at all, and that is a weak +0.22. Everything else on this page is some expression of the real interest rate. Gas is weather.
On ApeX's tape it is the only one of the four at its highs — though only just. At $3.43 it sits 0.3% above the highest weekday close of the last 90 days, which puts it at 101.3% of that range, against 58.7% for crude, 37.5% for silver and 29.8% for gold. It has cleared the prior high by about one tick, not by a margin. Volatility has gone from 20.8% to 43.7% annualised in a month, the largest regime shift of any contract here. And it carries by far the largest book on the venue's commodity board — 208,330 units, about $714,600 of notional, more than double the next largest.
A basis warning before you trade it. ApeX's gold, silver and crude contracts track their underlying within about 1%. Natural gas does not: at $3.43 the contract sits somewhere between 6% and 10% above the NYMEX November Henry Hub contract, which closed on 9 October between $3.12 and $3.22 depending on which feed you take.
Two things say this is the index rather than the perp trading rich. The contract's own index price is $3.43, identical to its last traded price, so the premium is inside the reference, not in the order book. And funding sits at the venue's flat +0.00125% baseline, the same figure every contract on ApeX prints, so nothing is signalling a crowded long. The most likely explanation is the index referencing a later or blended contract month: winter gas trades at a premium, and the December-February strip is at $3.49 — $3.43 sits most of the way from November's price to that winter strip, which is exactly where a blended index would land.
What it means practically is that the contract's 13.2% weekly move is larger than the physical benchmark's, which rose somewhere between 3% and 6%. Trade the contract you are actually in, and do not quote its return as a Henry Hub return.
What drove the move, on the physical side, was supply rather than demand. Lower-48 production fell from records of 113.3 Bcf/d in August and September to about 111.5 Bcf/d month-to-date in October, on Gulf offshore outages and pipeline force majeures in Kentucky, Texas and West Virginia. Hurricane Isaias cut offshore flows ahead of landfall. Weekly storage injections have run consistently at or below the five-year norm: 40, 44, 53, 64 and most recently 85 Bcf.
And now the problem. Two things argue hard the other way:
Storage is comfortable. The 8 October EIA report showed working gas at 3,500 Bcf — 2.0% above the five-year average, even though 3.6% below a year ago. The 85 Bcf build beat the 79 Bcf consensus, and prices fell on the print. The EIA expects 3,850 Bcf by the end of October.
This is shaping up to be a historically strong El Niño. NOAA's 8 October advisory puts the September Niño-3.4 relative anomaly at +2.1 °C, up from +1.7 °C in August, with a 100% chance the event is very strong over September-November, an 83% chance it qualifies as "historic" — a relative anomaly above +2.5 °C — over October-December, easing to 70% for November-January. El Niño winters are warm winters, and warm winters do not burn gas. The December-February strip is already at $3.49 against $3.96 for the same months last winter, and C.H. Guernsey's Zhen Zhu expects Henry Hub to average about $3.50 across those months, roughly 12% below last winter. The EIA's October outlook has 2027 averaging $3.16.
LNG is not helping right now either: feedgas is running 16.9 Bcf/d month-to-date against 17.9 in September and an April record of 18.8, on a Freeport train outage and planned Cove Point maintenance.
So the contract is at its highs on a supply interruption, into a record-warm winter signal and record annual production. That tension is the trade, and it has a date on it: NOAA publishes its 2026-27 US Winter Outlook on Thursday 15 October at 11:00 ET, half an hour after the weekly storage report lands at 10:30.
Six contracts, three bets
ApeX lists six commodity perpetuals. They do not give you six positions.
Gold and silver are one trade. XAU and XAG correlate at 0.91 on 60 sessions of weekday returns. Silver is simply the higher-beta expression — 38.3% annualised volatility against gold's 20.4%, and a 50% drawdown against gold's 25%. Holding both is holding one view on real yields, sized twice. The gold-silver ratio at 68.9 is the only thing that actually distinguishes them, and it has stayed inside a 67-72 band all quarter.
Crude, Brent and the oil ETF are one barrel. CL and USO correlate at 0.99. CL and BZ at 0.97. BZ and USO at 0.96. Three tickers, one position — with the single caveat that the Brent-WTI spread discussed above is a genuine relative trade precisely because the two legs are not perfectly identical.
Natural gas is the only thing here that diversifies anything, and that is the most useful fact on this page. In a set where everything else is a derivative of the real interest rate, the one contract driven by weather and storage is the one that behaves differently. It also happens to carry the largest book on the board.
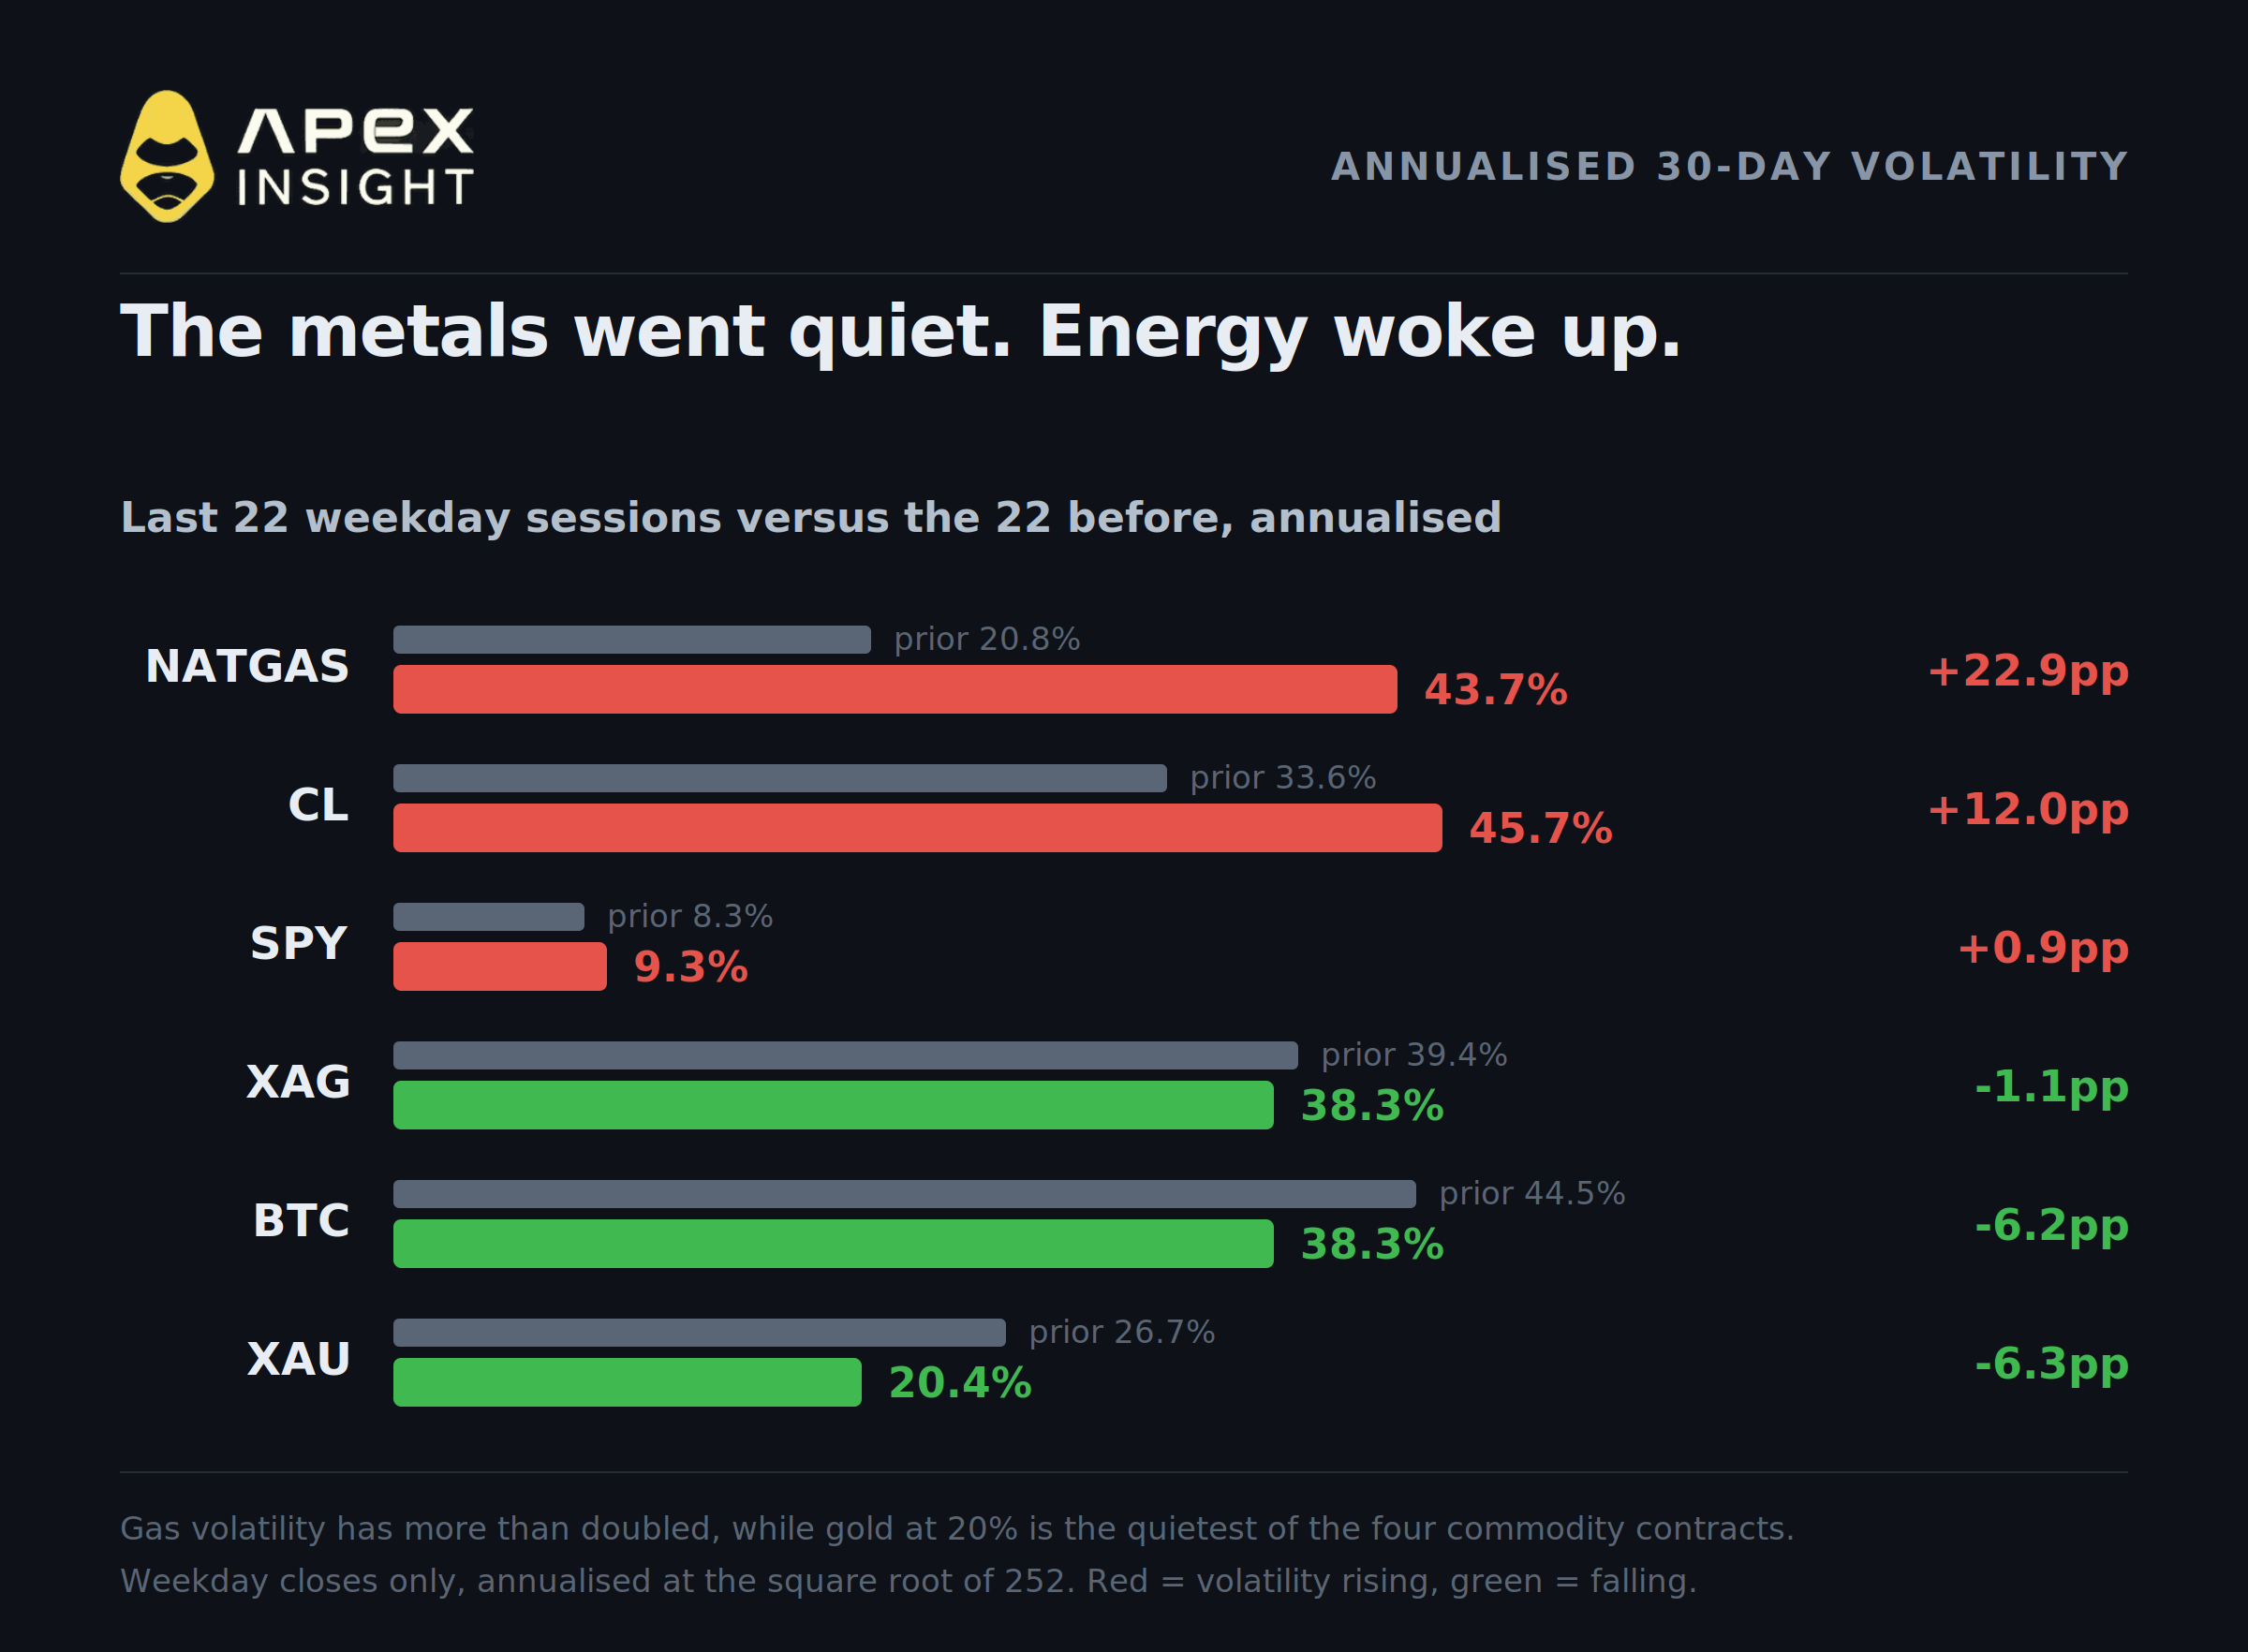
One more pattern worth noting. Volatility has moved in opposite directions across the two halves of this group: it fell in the metals over the last month, from 26.7% to 20.4% in gold and 39.4% to 38.3% in silver, while it rose sharply in energy, from 33.6% to 45.7% in crude and from 20.8% to 43.7% in gas. The monetary trade has gone quiet and the physical trade has woken up. For most of this year that was the other way round.
What to watch, in order
Date | Event | Contract |
|---|---|---|
13 Oct | OPEC Monthly Oil Market Report | CL |
14 Oct | US CPI — the input for the October FOMC | all four |
14 Oct | IEA Oil Market Report | CL |
15 Oct, 10:30 ET | EIA weekly gas storage (week to 9 Oct) | NATGAS |
15 Oct, 11:00 ET | NOAA 2026-27 US Winter Outlook | NATGAS |
15 Oct, 12:00 ET | EIA Weekly Petroleum Status Report, holiday-shifted | CL |
20 Oct | NYMEX WTI November contract expiry | CL |
27-28 Oct | FOMC — October largely priced out, December ~80% priced in | XAU, XAG |
28 Oct | NYMEX Henry Hub November expiry | NATGAS |
1 Nov | Next OPEC+ ministerial | CL |
3 Nov | US midterms, the date Trump's pledge of no strike on Iran runs to | CL |
10 Nov | EIA Short-Term Energy Outlook | CL, NATGAS |
The hinge for three of the four is the same: whether the Fed delivers in December. Roughly 80% of that is priced. Governor Chris Waller said in early October that he anticipates additional hikes, noting they need not come at consecutive meetings. If December is confirmed, the real-yield pressure on the metals continues. If the October CPI print is soft enough to take December off the table, the two most beaten-up contracts on this page are also the two with the most room to recover.
Gas does not care about any of it.
Last call: the Daily Trading Check-In closes tonight
The Daily Trading Check-In ends today, 10 October, at 24:00 UTC. This is the final check-in of the campaign — after tonight there is no more.
The mechanic has not changed:
Register for the campaign
Trade at least 5,000 USDT of Perpetual volume within the UTC day
Earn a 10 USDT Perpetual Trading Bonus
Volume resets at 00:00 UTC and does not carry over, so everything you traded yesterday is already settled and today's count started fresh. The total reward pool is 3,000 USDT, daily rewards are limited and allocation is first-come, first-served — which on the closing day is the binding constraint, not the volume threshold. Wash trading, volume manipulation, multi-account farming, self-dealing and market manipulation are all grounds for disqualification under the terms.
Full mechanics and terms: Daily Trading Check-In
Price, volume, open interest and return data are from ApeX Omni contract data as of 10 October 2026, roughly 08:30 UTC. Returns are close-to-close on calendar-day bars, so a 7-day return is seven bars and a 30-day return is thirty. Peak drawdowns are measured from the highest print on ApeX's weekly series, which begins 5 January 2026 for gold and silver and 11 May 2026 for crude and natural gas; the daily series only reaches back to late March and does not contain the January highs.
Volatility uses weekday closes only, because ApeX prints calendar-day bars while the underlying markets are closed at weekends. Range positions take their high and low from the same weekday closes but measure the current live price against them, which is why natural gas can read above 100%. Volatility is annualised at the square root of 252 weekday observations. Spot, futures, storage, production and policy figures are from the EIA, IEA, NOAA, the World Gold Council, the Silver Institute, company and central-bank releases and the sources named inline.
Nothing here is investment advice; commodity perpetuals carry leverage risk, settle against an index rather than a deliverable barrel or ounce, and that index may differ from the headline futures contract, as the natural gas basis above shows.