





Note: All contract prices, percentage moves and range positions are ApeX Omni order book data as of 8 October 2026, taken before the 08:30 Eastern jobless claims release. Economic data, Federal Reserve minutes, Treasury yields and analyst estimates are as published by the Bureau of Labor Statistics, the Federal Reserve, the US Treasury and major data providers as of the same date. Range positions are measured across the trailing 150 calendar days of each contract's daily closes. Markets move continuously and all figures will differ by the time you read this.
Nobody Is Getting Fired and Nobody Is Getting Hired: 5 Markets Pricing a Frozen Labour Market
Weekly jobless claims land at 08:30 Eastern this morning, with consensus at 200,000 against 197,000 last week. On its own that is a non-event, and it will probably print inside the range it has held all autumn.
The reason to care about it this week is what sits behind it.
On October 2 the September jobs report showed payrolls up 29,000 against expectations near 85,000 to 90,000, with July revised to minus 10,000 and August cut to 133,000. A combined 60,000 jobs disappeared in the revisions. The unemployment rate rose to 4.2%.
Then on October 7 the Federal Reserve published the minutes of its September meeting, the one where it raised rates a quarter point to 3.75% to 4.00%. Most participants said a further increase "would likely be appropriate by year end."
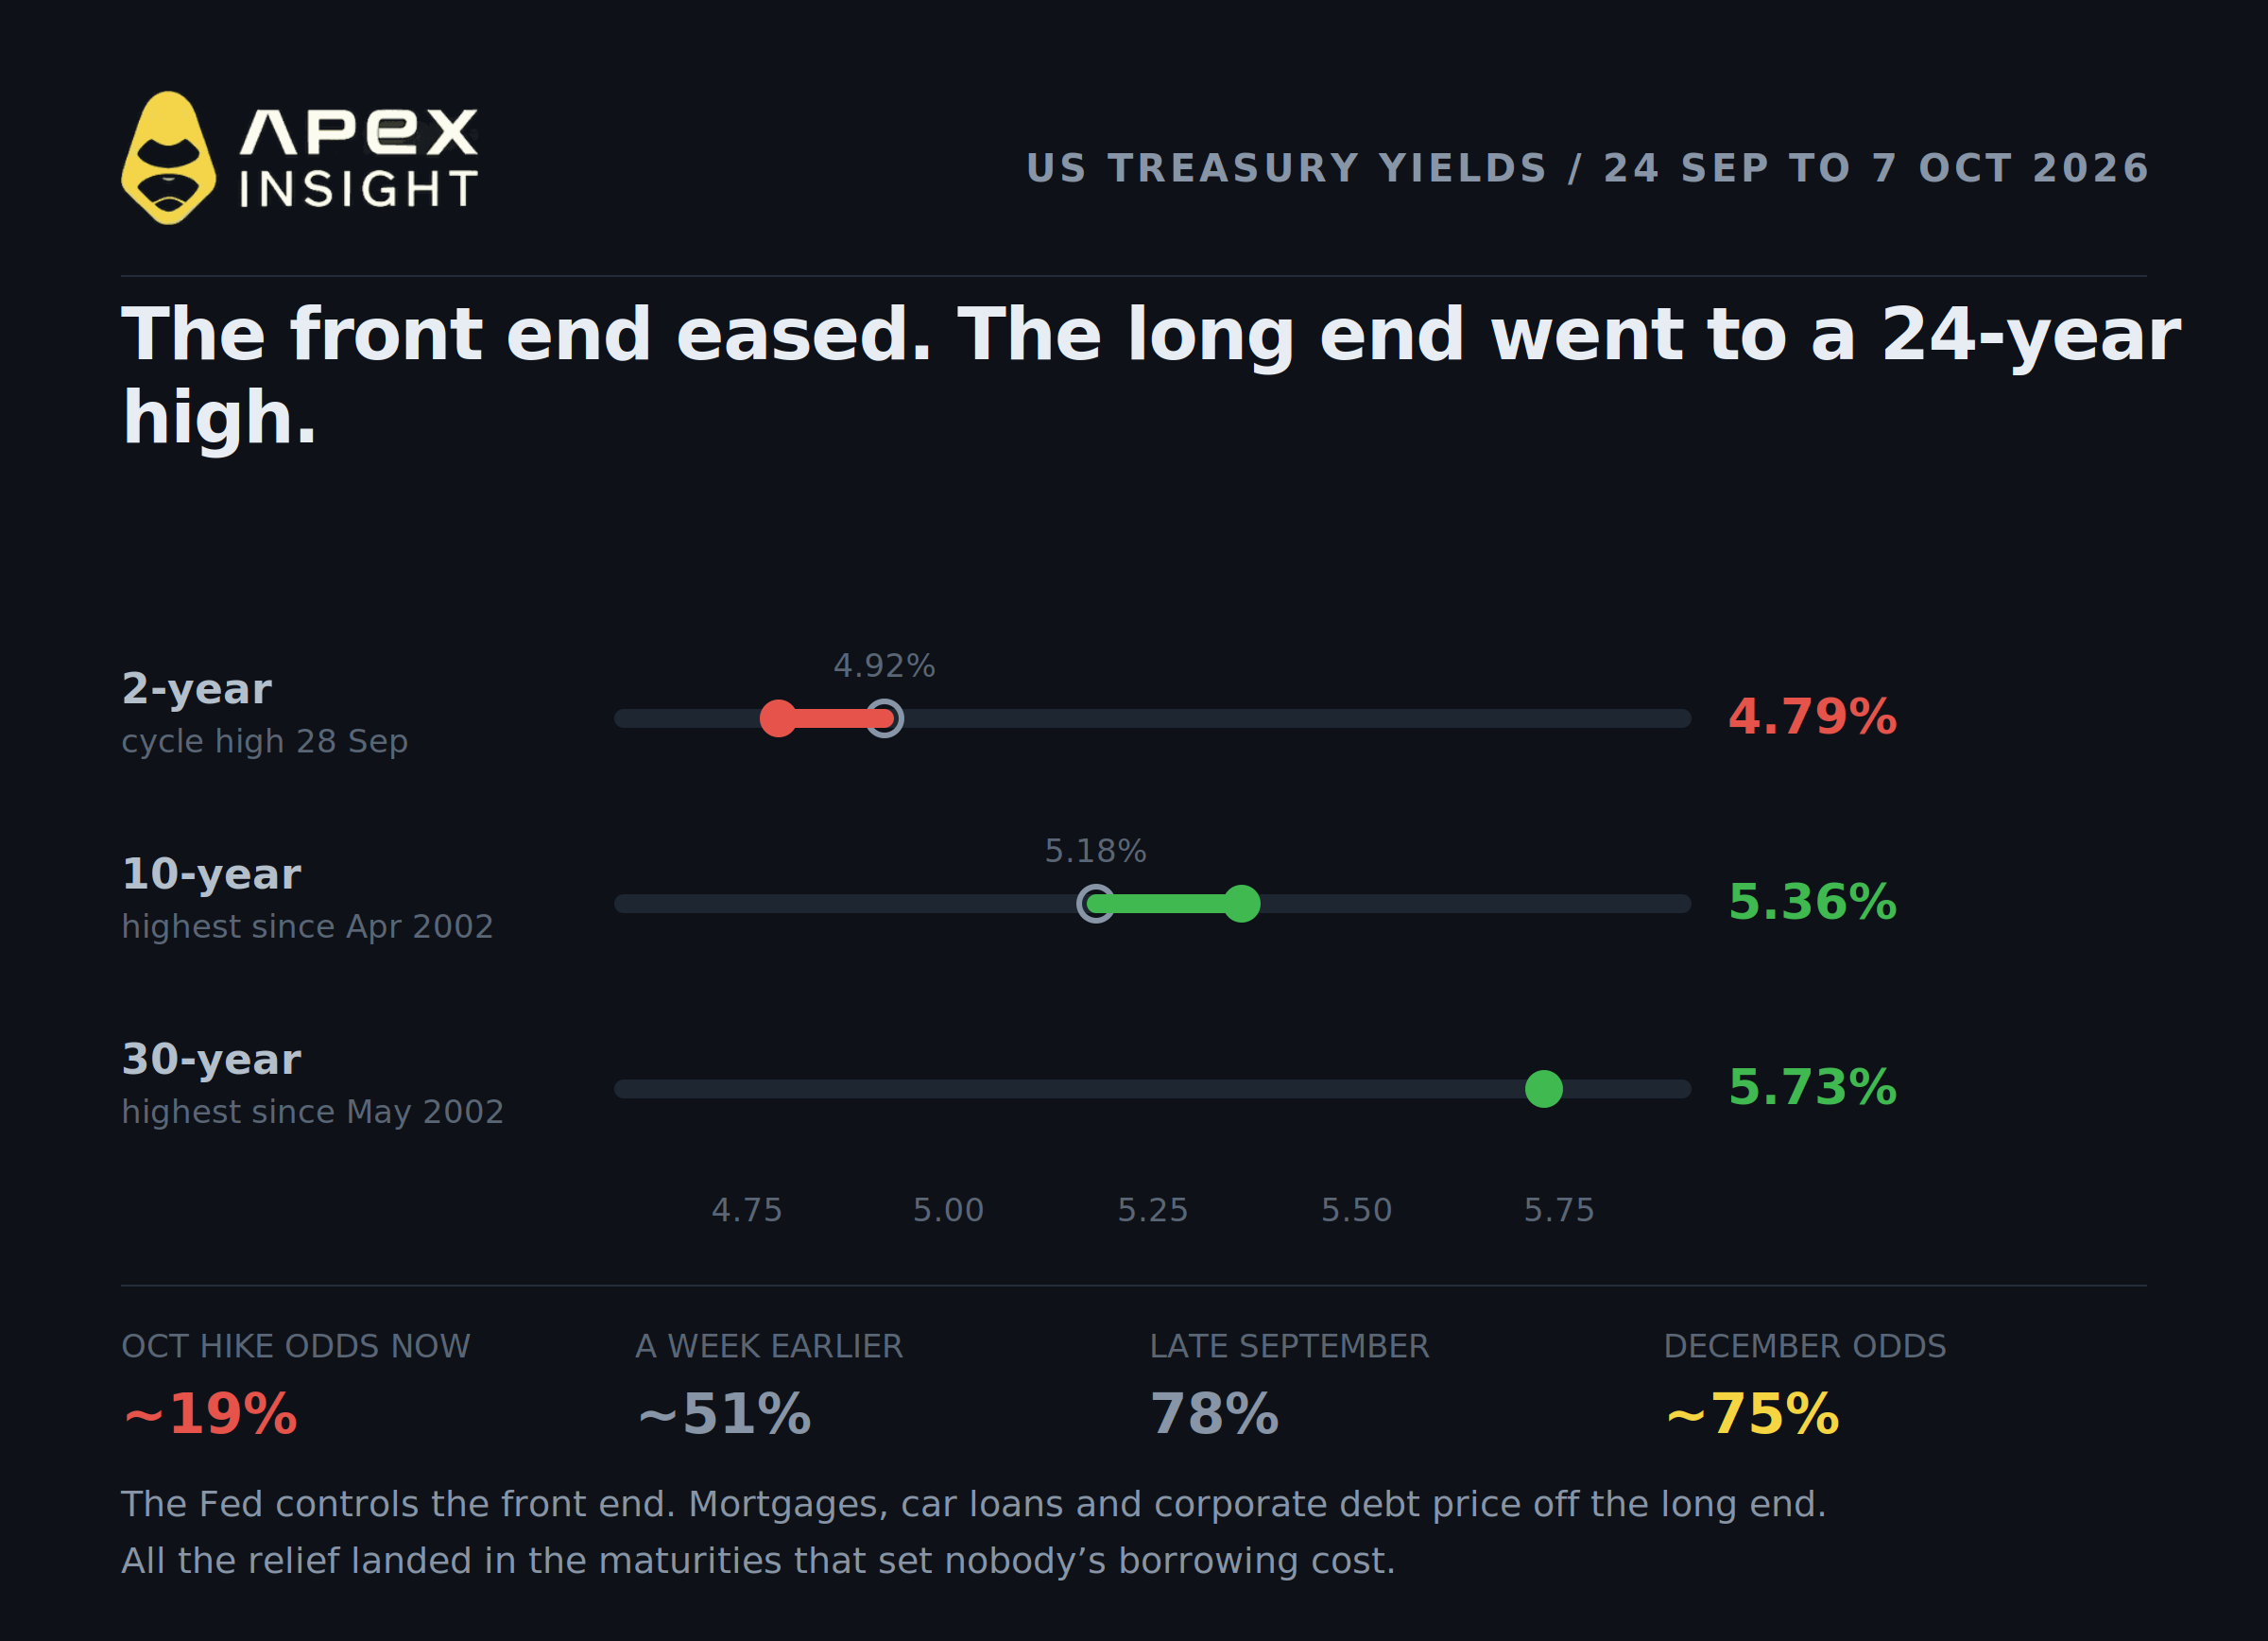
So the central bank intends to tighten into a labour market that added 29,000 jobs. The market's response has been to believe the destination and refuse the timing: odds of an October hike have fallen to roughly 19%, from about 51% a week earlier and 78% in late September, while December sits near 75%.
That gap is being expressed across five very different markets, and the mechanism connecting them is not the jobs number. It is the shape of the yield curve.
All prices are ApeX Omni marks as of 8 October 2026, before the claims release.
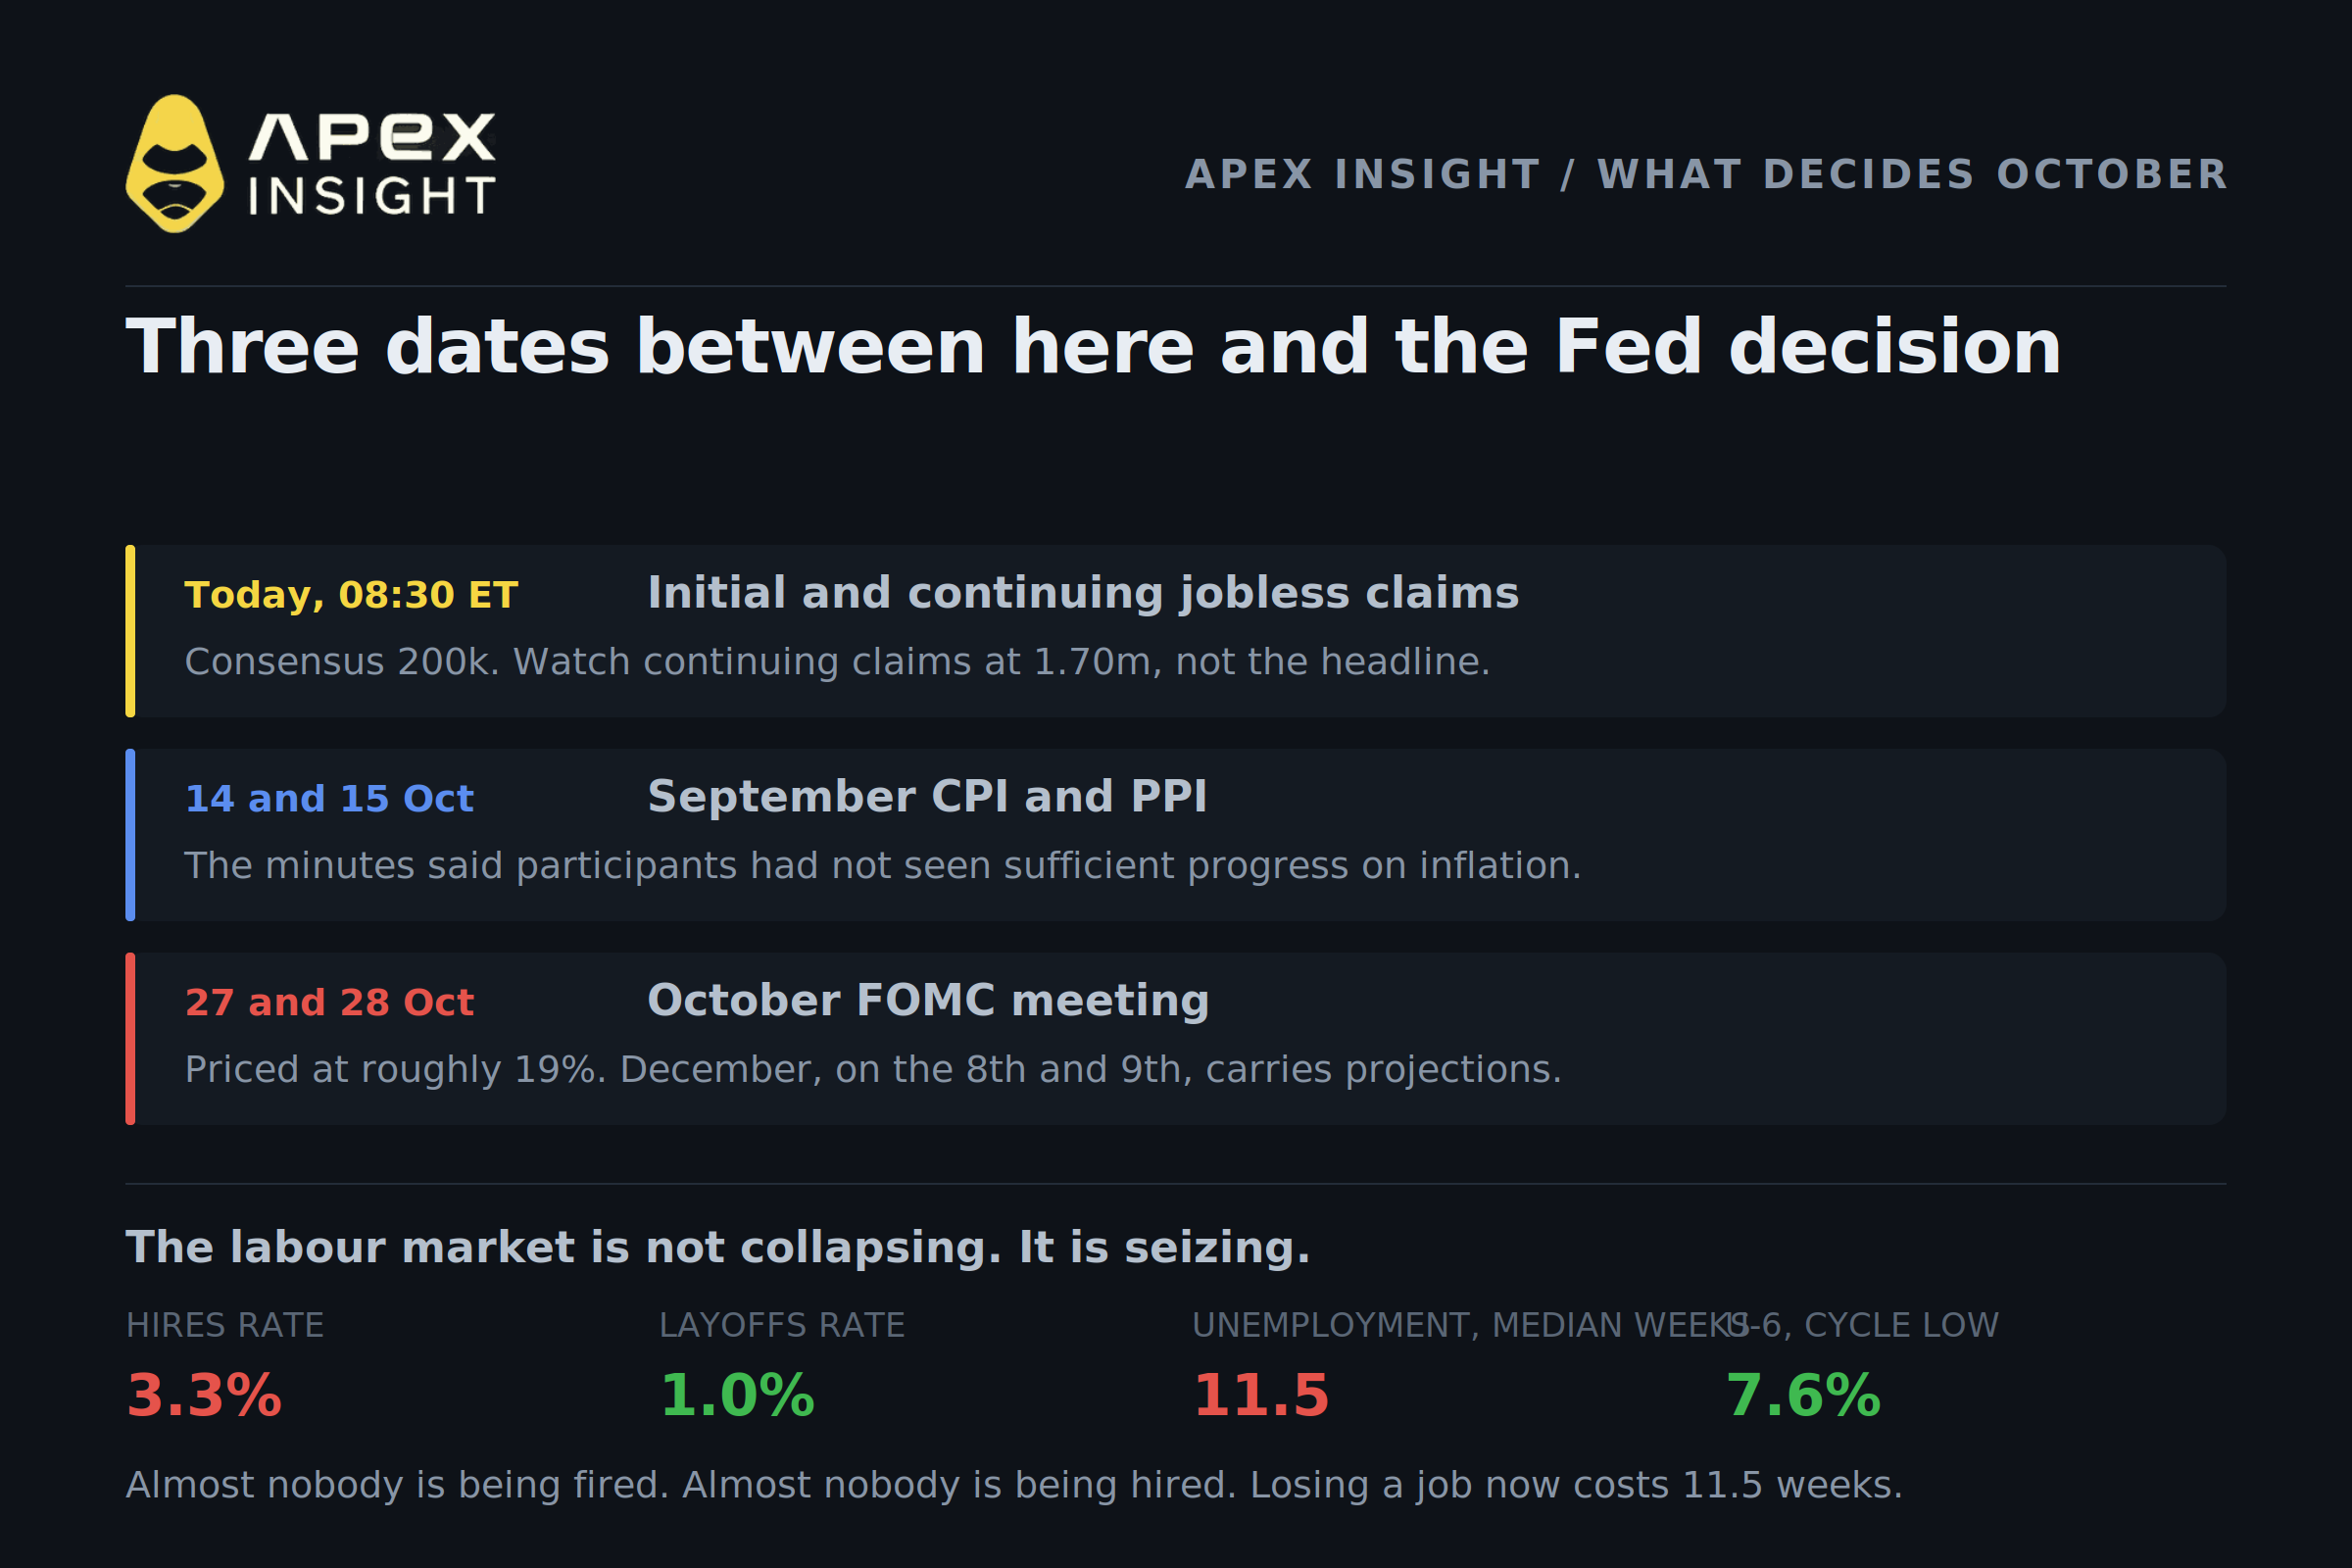
The labour market is not collapsing. It is seizing.
The word "weak" is doing a lot of unhelpful work in this week's coverage, because the data does not describe a labour market falling apart. It describes one that has stopped moving.
Hiring has slowed sharply. The hires rate in the August JOLTS report was 3.3%, well below the 3.8% to 4.0% that was normal before the pandemic. But layoffs are near a record low at 1.0%, and the quits rate is 1.9%, meaning almost nobody is leaving voluntarily either.
Two details from the September report cut against the collapse narrative outright. Labour force participation rose to 61.8% from 61.6%, so part of the uptick in unemployment is people coming back to look for work rather than losing jobs. And the broader U-6 underemployment rate fell to 7.6%, a cycle low.
The cost of this shows up somewhere else entirely. The median duration of unemployment has risen to 11.5 weeks from 10.5 in July, and 27.1% of unemployed people have now been out of work for more than six months, up from 25.3% in February. If you have a job you are very unlikely to lose it. If you lose one, it now takes considerably longer to find the next.
The Fed described this in its own minutes, using language dated September 16, two weeks before the payroll miss: "Several participants noted that dynamism in the labor market was unusually low."
What to watch in today's claims print: not the headline. Continuing claims, which have fallen about 120,000 since late June to 1.70 million. Initial claims measure firing. Continuing claims measure how hard it is to get rehired. If that number starts climbing while initial claims stay near 200,000, the freeze is turning into something worse.
The yield curve split, and that is why these five markets disagree
Here is the part that explains everything below.
Over the past two weeks the two-year Treasury yield has fallen, from a cycle high of 4.92% on September 28 to around 4.79%. That is the market pricing a Fed that may not move in October.
Over the same period the ten-year yield rose, touching 5.36% intraday on October 7, its highest since April 2002. The thirty-year hit 5.73%, the highest since May 2002. The gap between the two and the ten year has widened by roughly 30 basis points in a fortnight.
The front end of the curve is the part the Fed controls. The long end prices tariff inflation, Brent crude above $100, and the supply of Treasury debt. A softening labour market has eased the first and done nothing at all for the second.
Which means the relief is landing exclusively in the maturities that do not set anybody's mortgage, car loan or corporate borrowing cost. That single fact explains why gold will not rally on dovish repricing, why consumer stocks are being destroyed while the index sits near a record, and why money is leaving crypto for a 5.3% risk-free rate.
1. Gold: the dovish trade that refuses to work
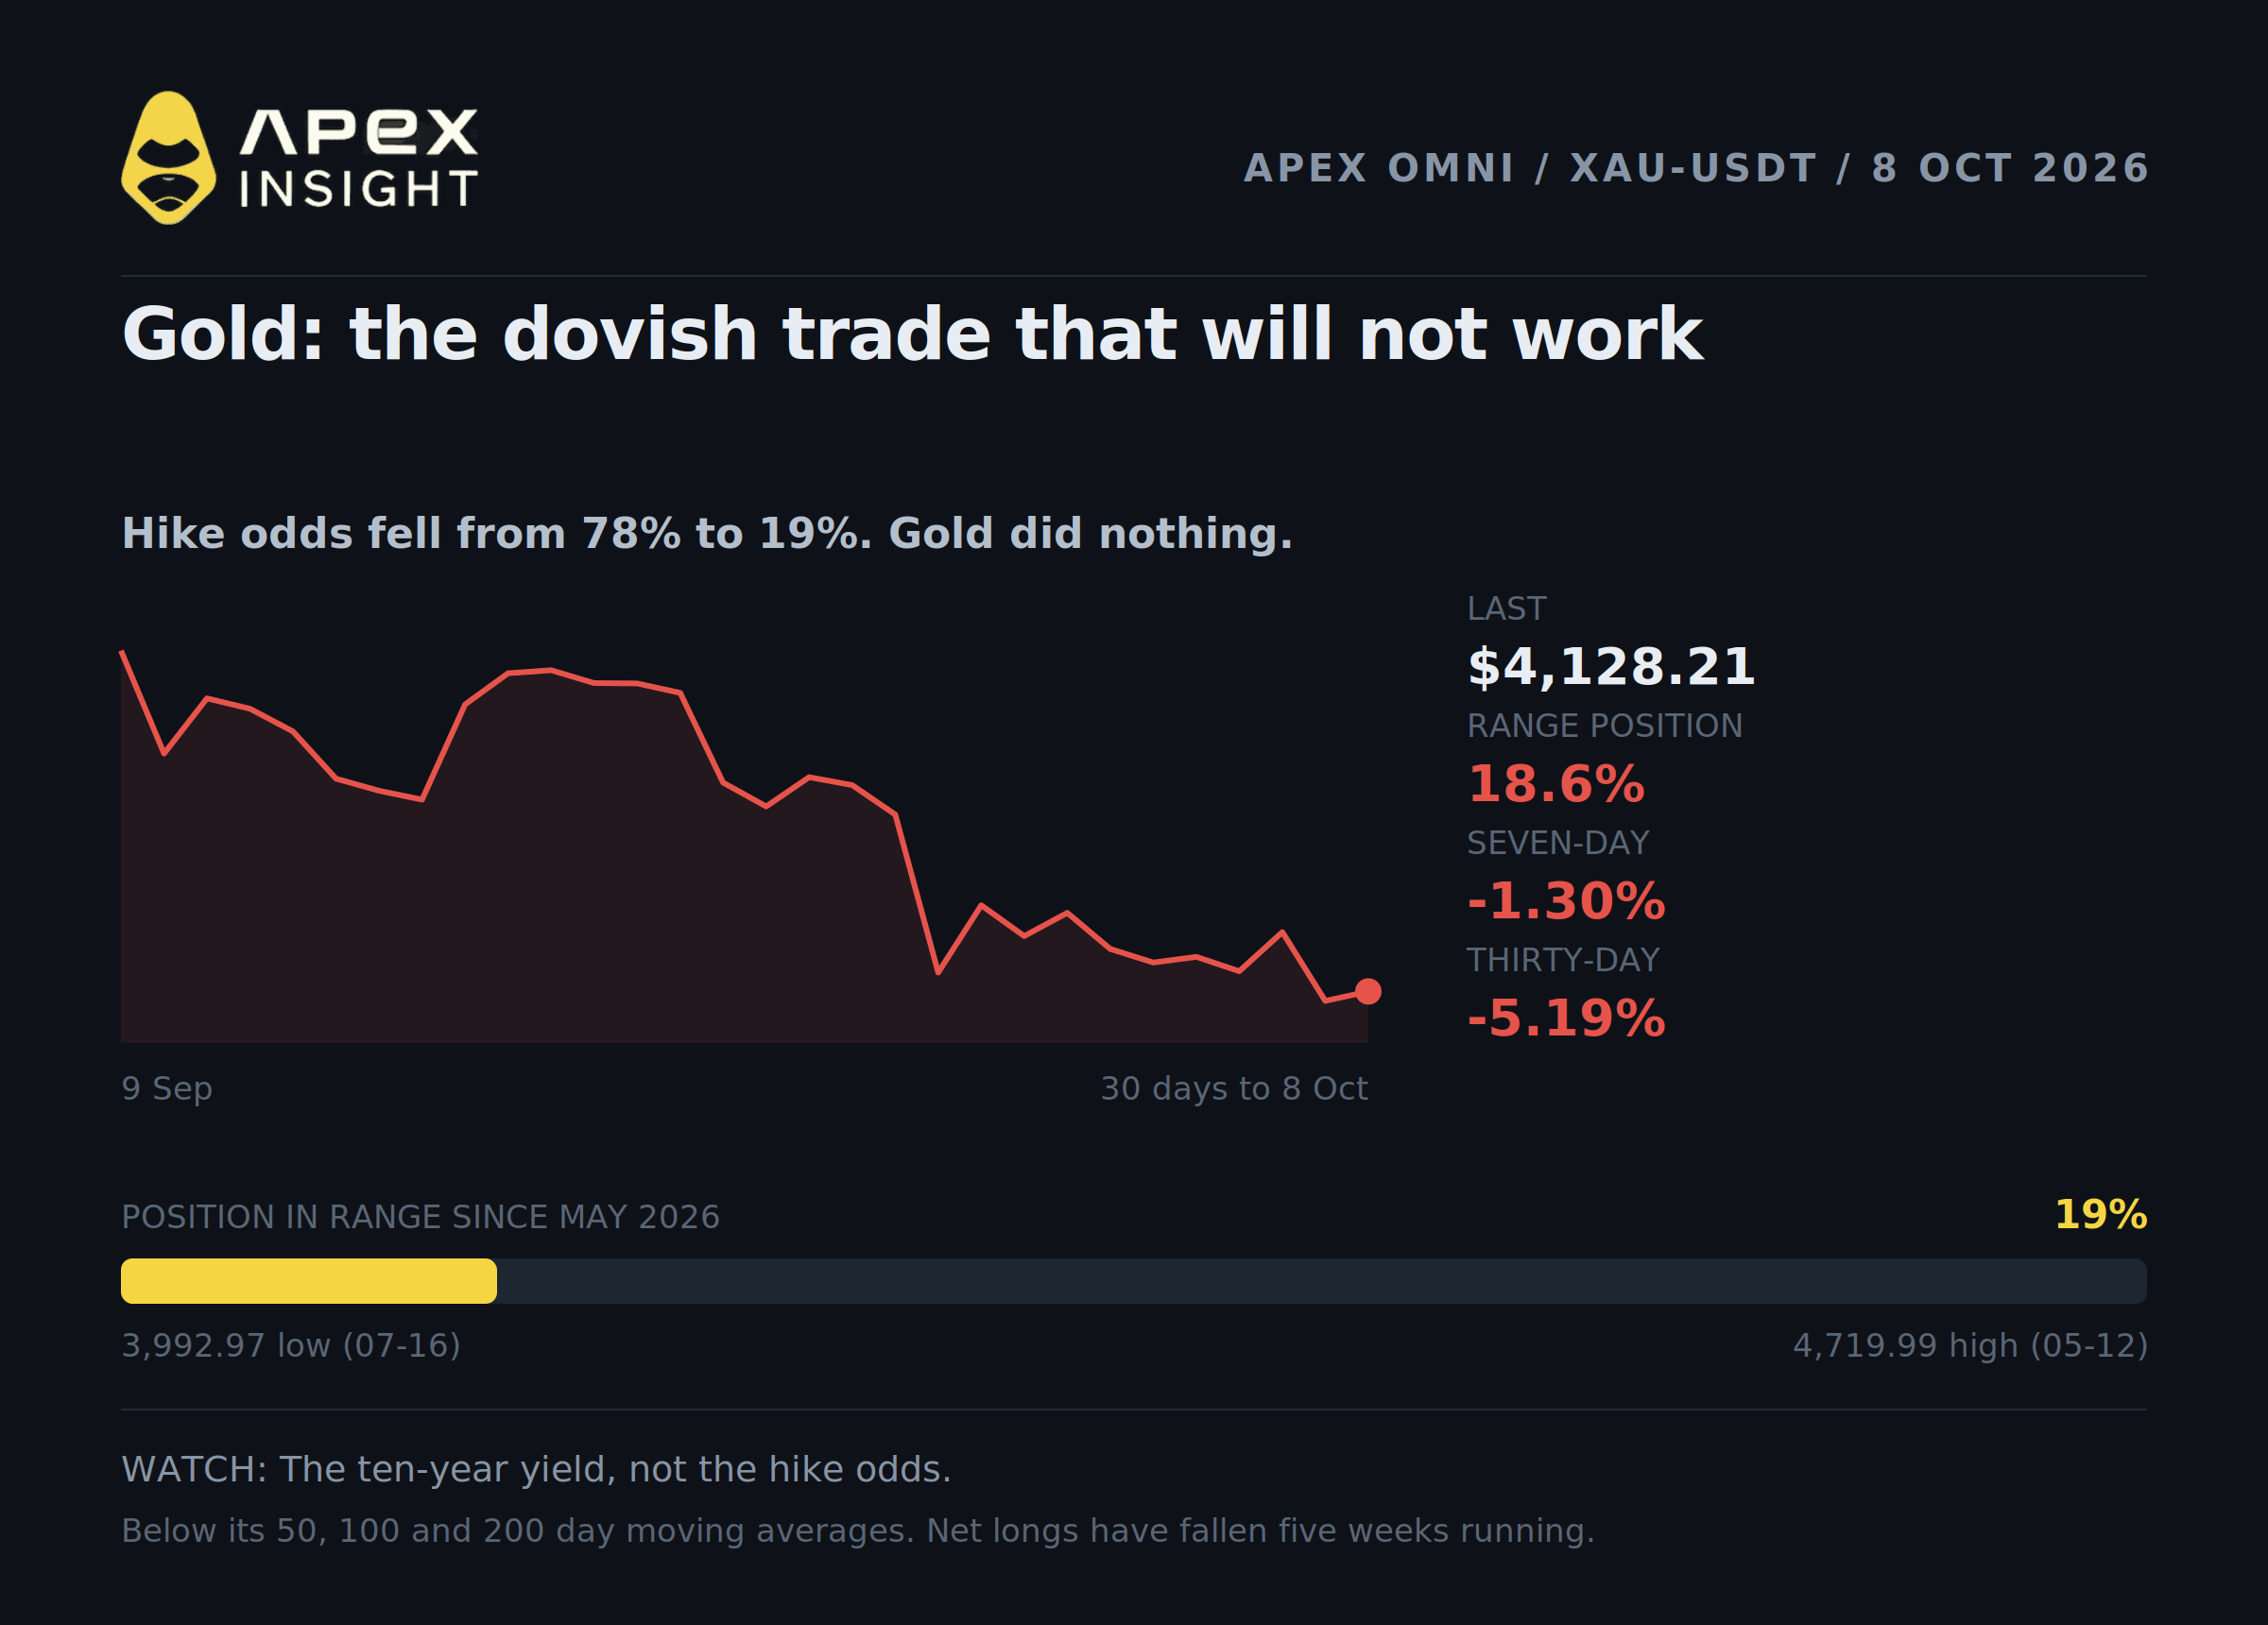
XAU-USDT, $4,128.21, up 0.24% on the day, 50x maximum leverage
The textbook says that when rate hike odds collapse, gold rallies. Hike odds for October fell from 78% to about 19% in two weeks and gold did essentially nothing.
It sits at 18.6% of its trading range, the weakest position of any instrument in this article, down 1.30% over seven days and 5.19% over thirty. It trades below its fifty, hundred and two-hundred day moving averages, which is a textbook downtrend, and it is negative on the year. The contract's own high over the past five months was $4,719.99 on May 12, roughly 14% above where it trades now.
The reason is the curve split. Gold pays no yield, so it is priced against long-dated real rates, not against the Fed funds rate. The Fed controls the short end. Gold needs the long end, and the long end is at a 24-year high while the dollar sits at its strongest since April 2025.
Positioning has followed. Comex managed money net long positions have now fallen for a fifth consecutive week, to about 387 tonnes. TD Securities has flagged the levels working against gold rather than for it: below roughly $4,367 systematic funds flip to being moderate sellers, and below $4,300 large scale selling becomes easier to trigger. Gold is currently beneath both.
The historical pattern worth knowing: in the Volcker era, the 2013 taper tantrum and the 2018 cycle, gold turned when the market perceived the peak in rates, not at any particular yield. On that framework, gold is waiting for a signal the Fed has not yet given.
Watch: the ten-year yield, not the hike odds. Gold cannot work until the long end turns.
2. The Nasdaq: a record index inside a recession-shaped economy
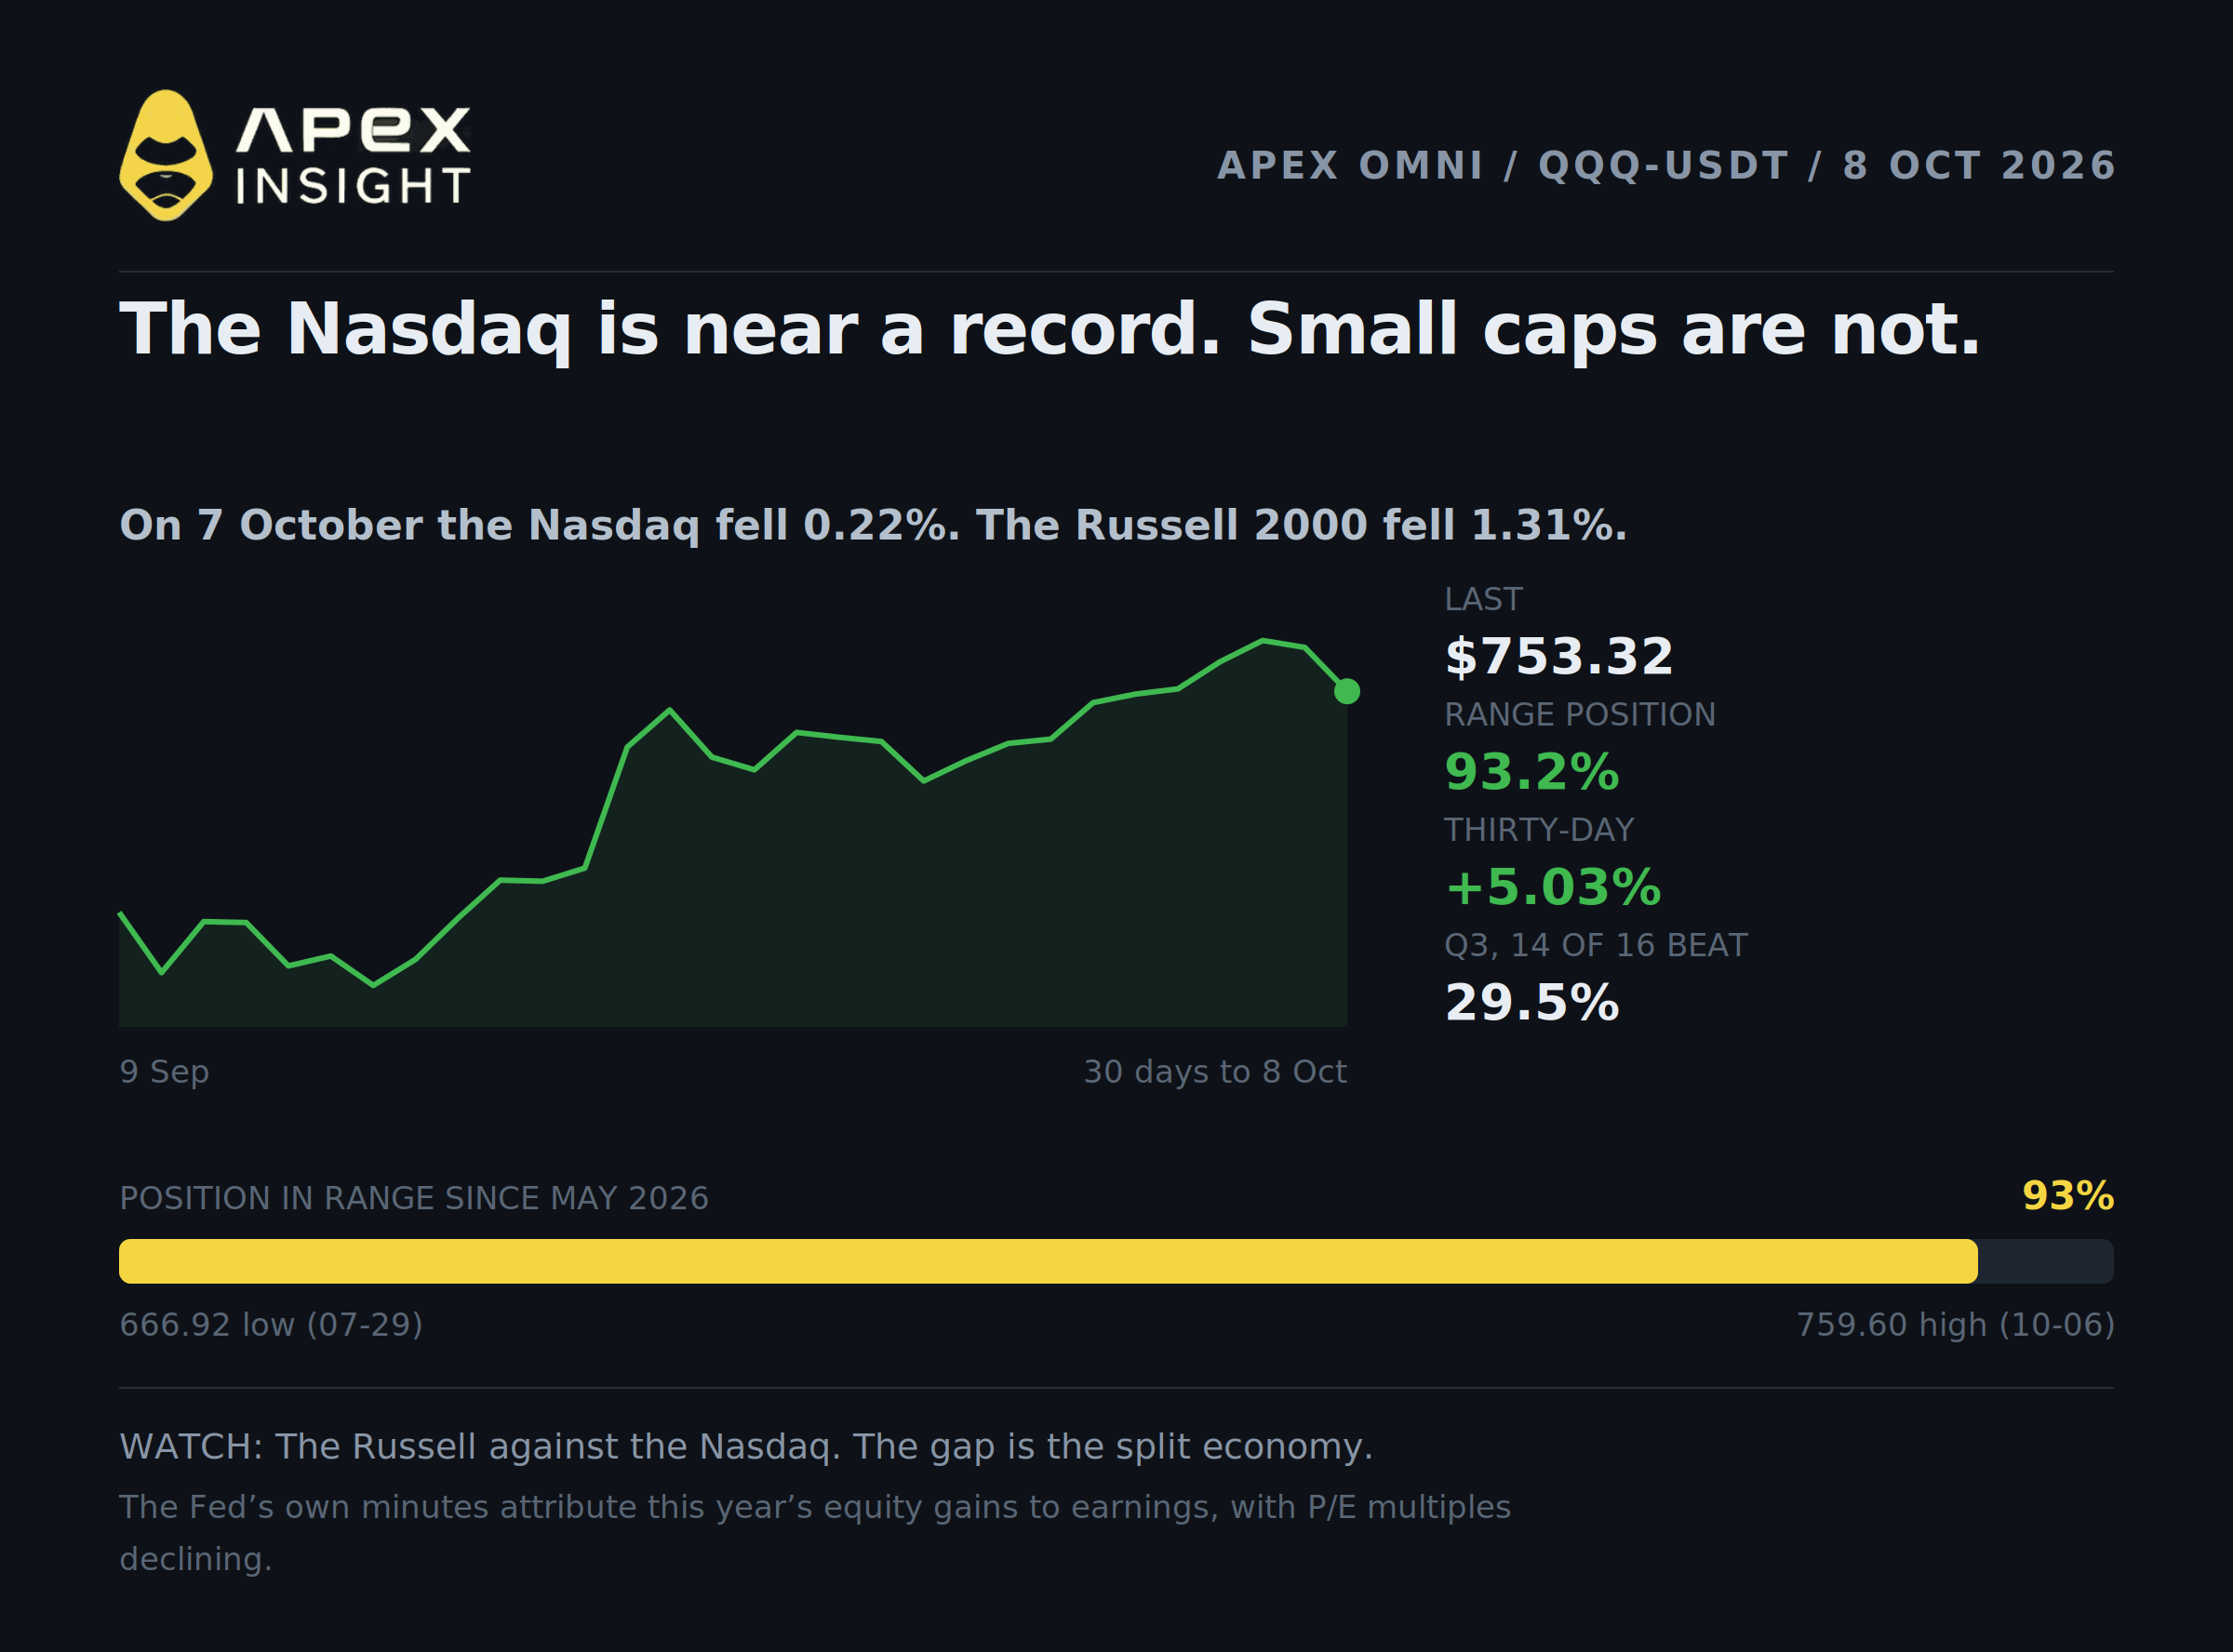
QQQ-USDT, $753.32, down 0.37% on the day, 50x maximum leverage
The Nasdaq-100 proxy sits at 93.2% of its range, up 5.03% over thirty days, within a fraction of the record closes posted on October 6.
That is remarkable given everything above, and the usual explanation is that it is a bubble. The Fed's own minutes disagree. The New York desk's assessment, recorded in the September meeting, was that the rise in equity prices this year was "entirely attributable to strong actual and expected corporate earnings," with price-to-earnings multiples actually declining.
The early third quarter reporters support that: of the first sixteen companies to report, fourteen beat, and FactSet's estimate for the quarter is about 29.5% year-on-year earnings growth. The index is up because profits are up, not because it is being revalued.
The risk is concentration rather than valuation. Nvidia, Apple and Microsoft together now exceed 21% of the S&P 500, the highest share three stocks have ever held, and the AI earnings story faces its real test over the next three weeks of reporting.
One number to keep alongside it. On October 7, while the Nasdaq fell 0.22%, the Russell 2000 fell 1.31%. Small caps are where a hiking Fed and a frozen labour market actually bite, because they borrow at the short end and they do not have AI earnings to offset it. The gap between those two indices is the cleanest read on the split economy available.
Watch: the Russell against the Nasdaq. The divergence widening is the signal that the index is carrying the economy rather than reflecting it.
3. Amazon: the only consumer megacap that still works
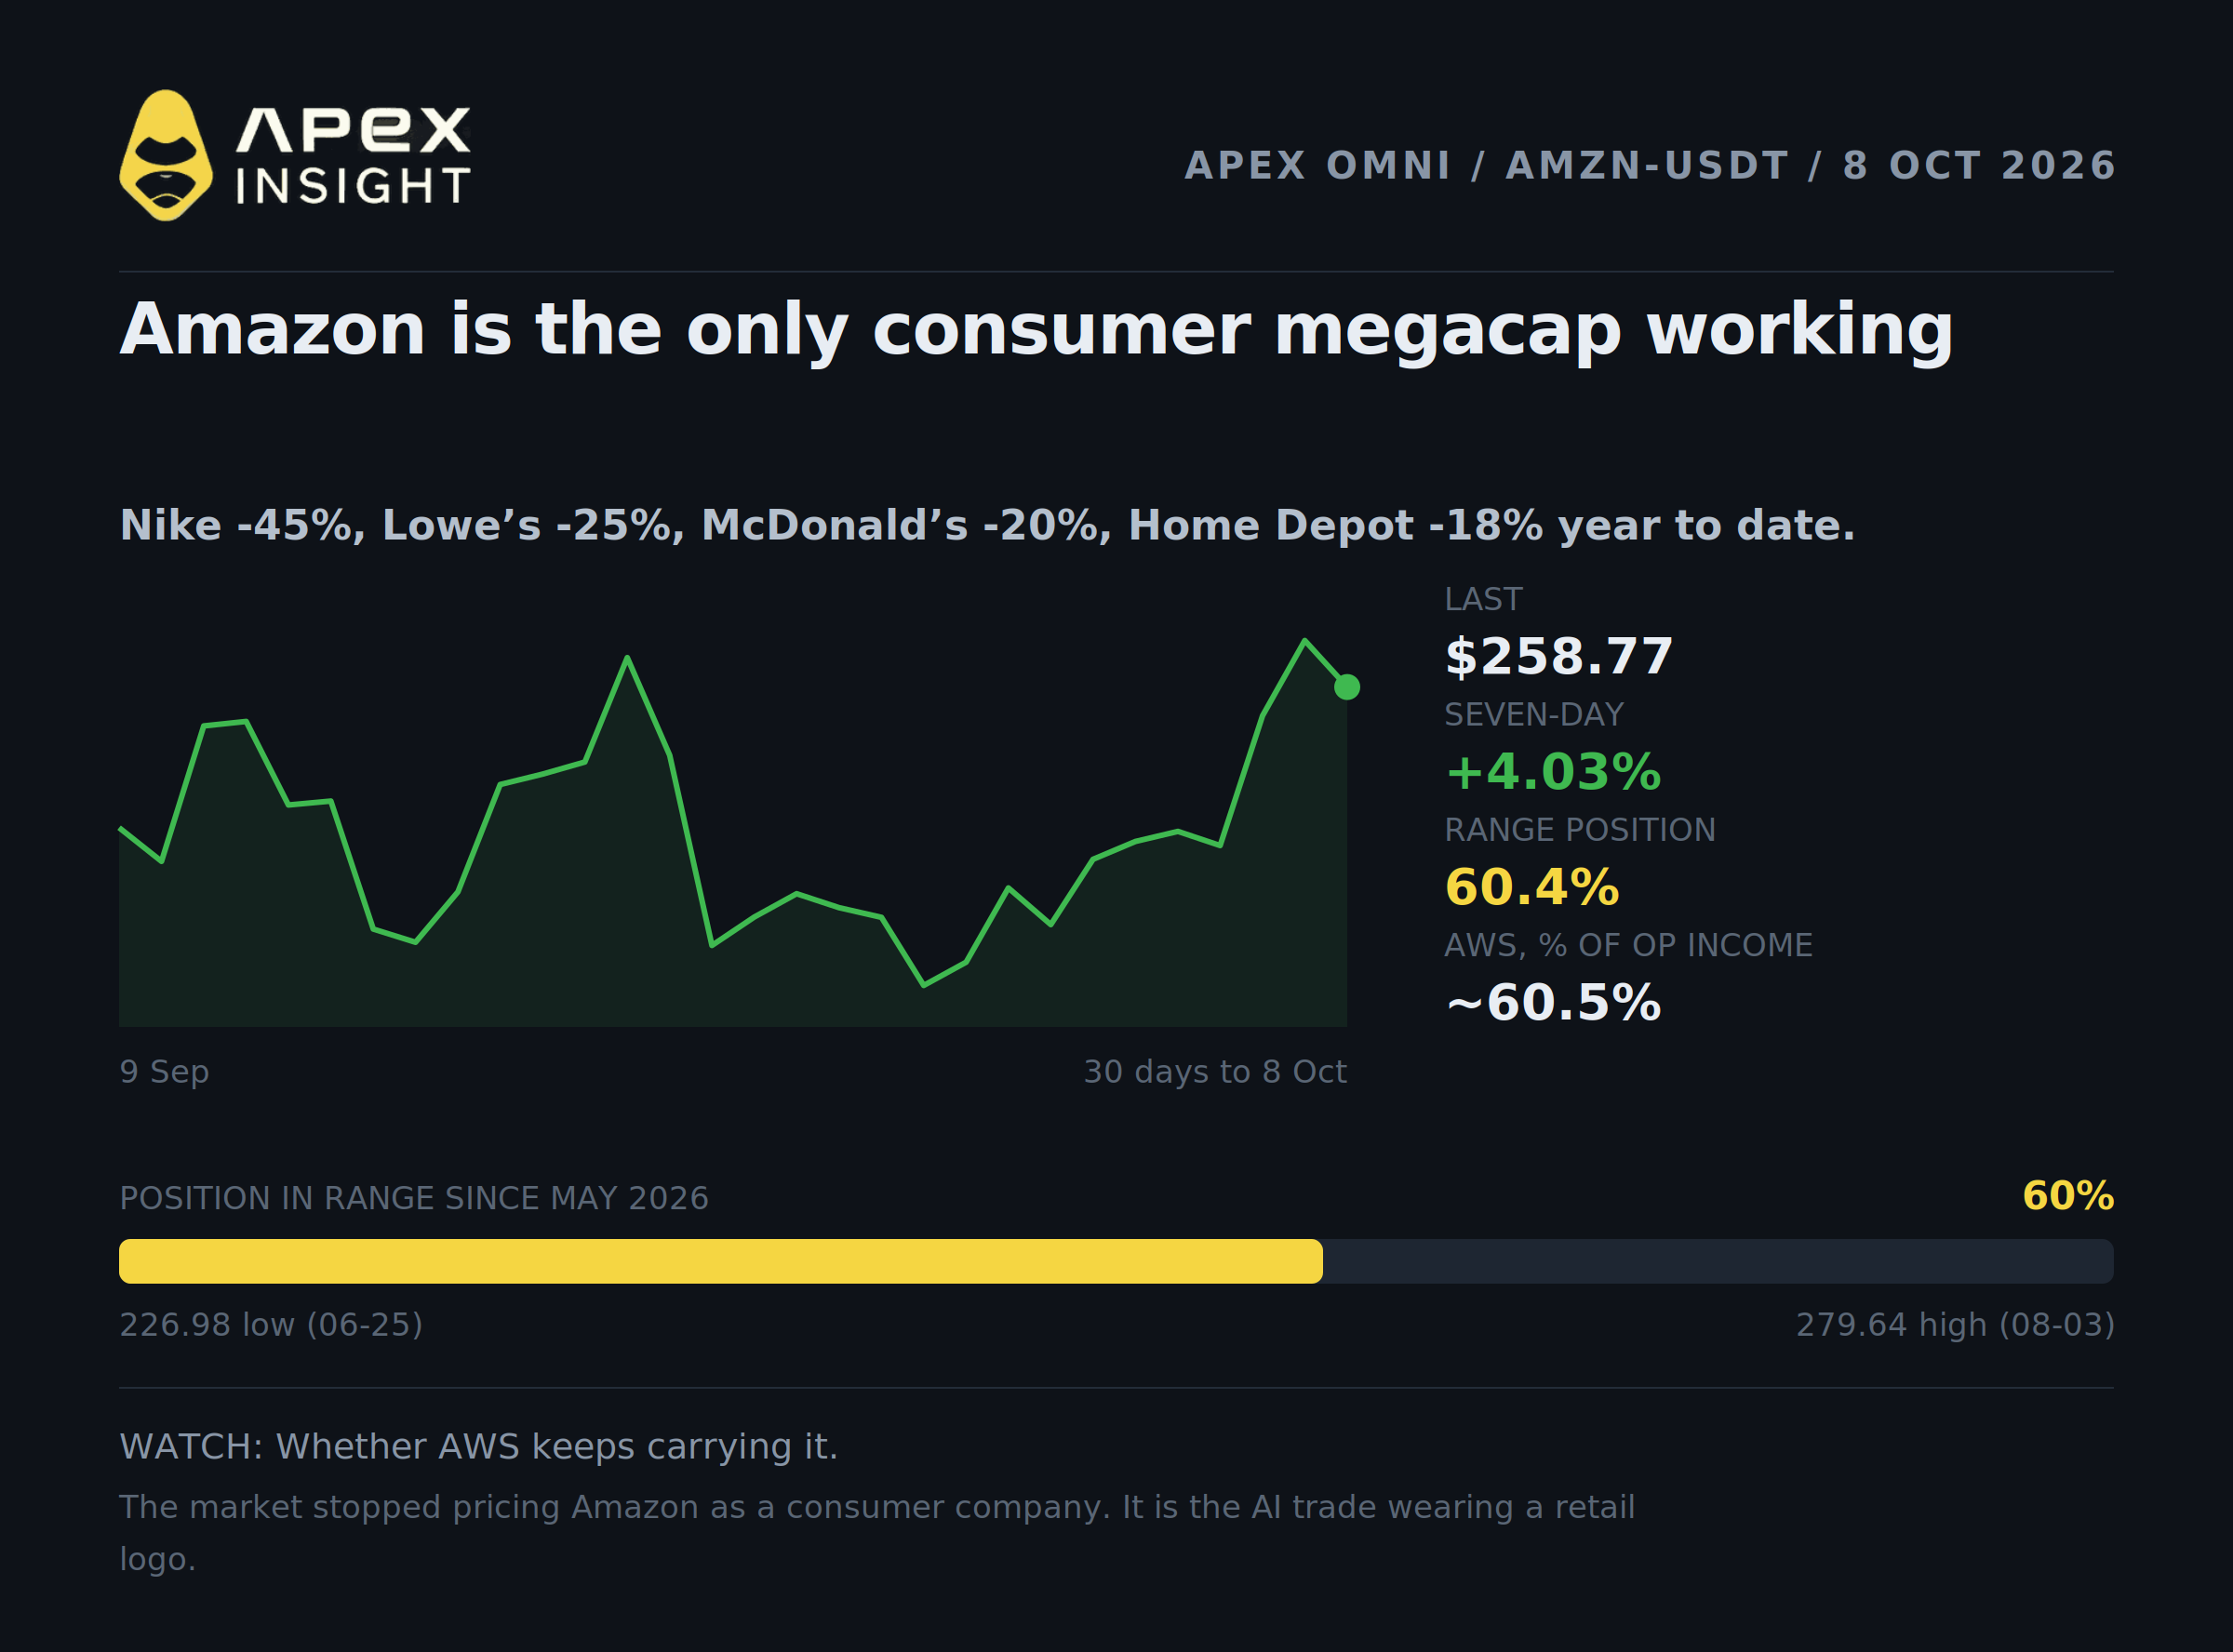
AMZN-USDT, $258.77, up 0.59% on the day, 50x maximum leverage
Consumer discretionary has been the clearest casualty of the rate move. The sector is down about 8% over the rise in yields, and the year-to-date damage among its largest names is severe: Nike down roughly 45%, Lowe's down 25%, McDonald's down more than 20%, Home Depot down 18%, Tesla down 17%.
Amazon is the only one of the sector's top five holdings positive on the year, and it is up 4.03% over the past seven days.
The reason is a reclassification rather than a retail outperformance. The market has stopped pricing Amazon as a consumer company. Amazon Web Services was roughly 60.5% of consolidated operating income in the second quarter, and the stock now trades on the AI infrastructure story rather than on what people are buying.
That is worth holding onto, because it means Amazon is not a hedge against consumer weakness. It is the same AI trade as the Nasdaq, wearing a retail logo. If you own it alongside QQQ you have less diversification than the sector labels suggest, which is the same trap we flagged in yesterday's memory piece.
Prime Big Deal Days ran on October 6 and 7, so that revenue lands in the fourth quarter rather than the third, and the next earnings report is expected around the end of October.
Watch: whether AWS keeps carrying it. The moment the AI story wobbles, Amazon reverts to being a retailer with a weak consumer.
4. Tesla: a delivery beat inside a downtrend
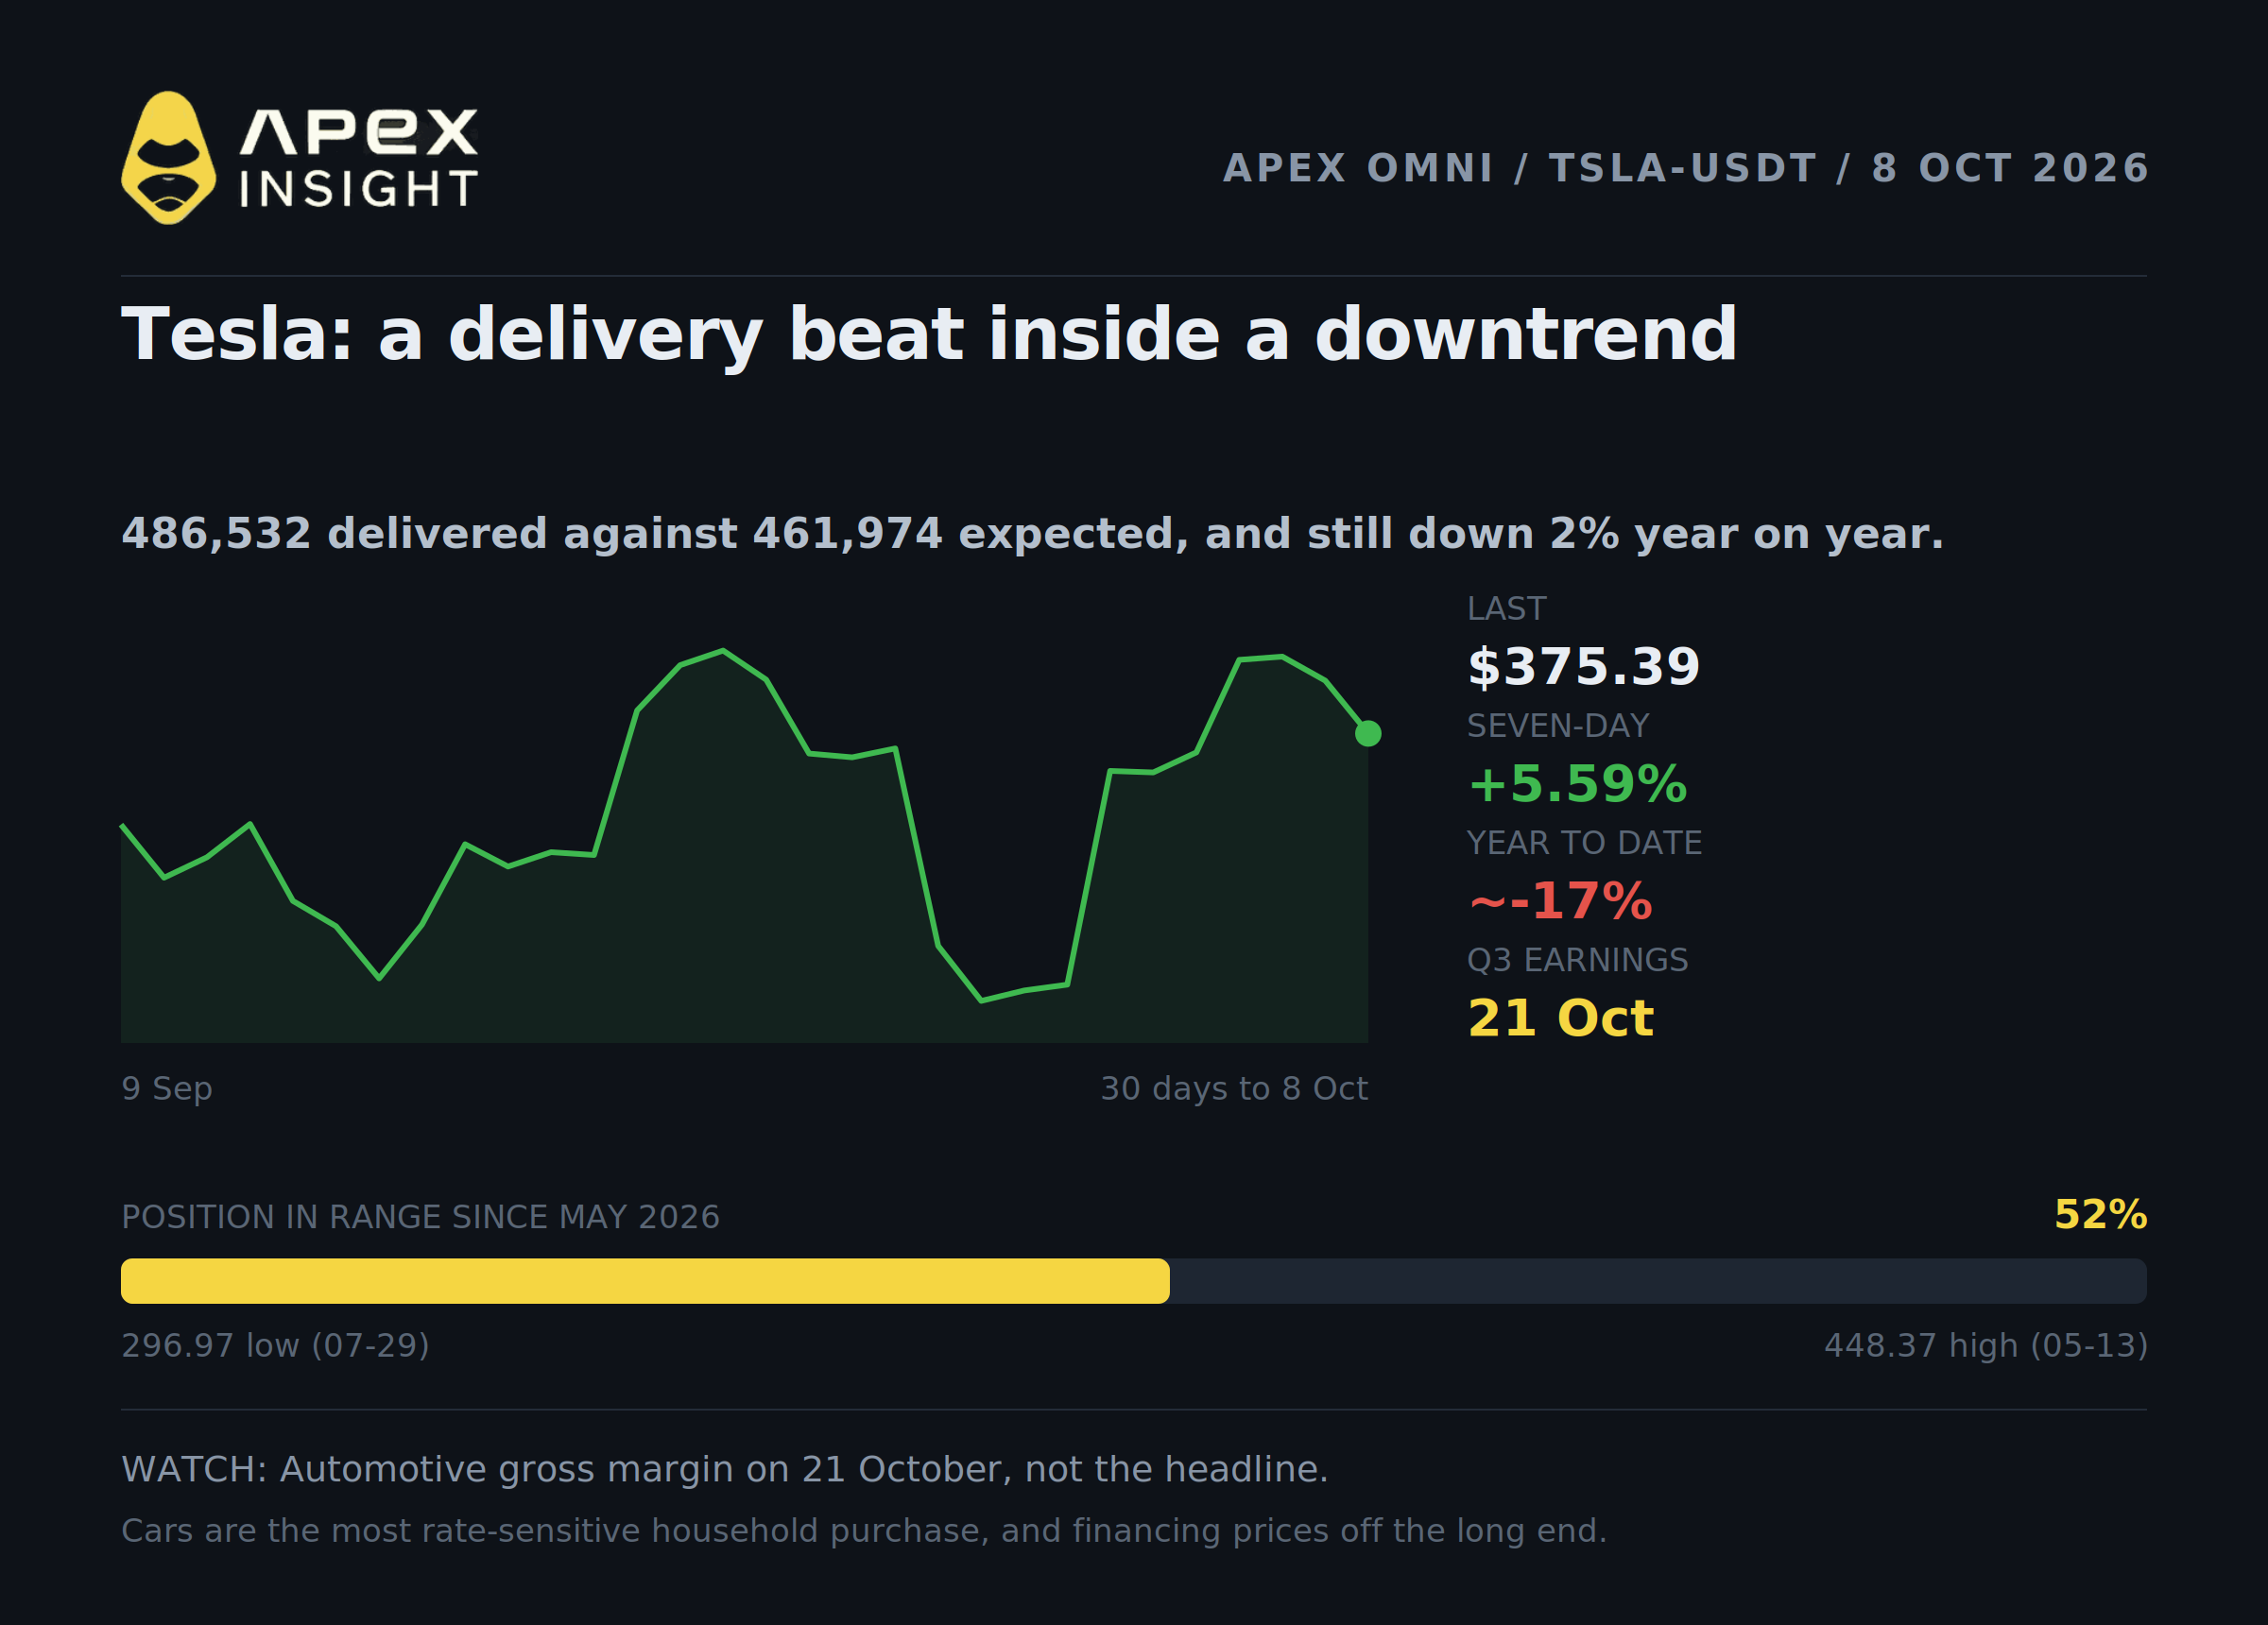
TSLA-USDT, $375.39, down 0.56% on the day, 50x maximum leverage
Tesla delivered 486,532 vehicles in the third quarter against a company-compiled consensus of 461,974, a clear beat, and the stock rose about 5% on October 2. It is up 5.59% over seven days and sits mid-range at 51.8%.
Two things qualify that. The beat was still a 2% decline year on year against 497,099 in the same quarter of 2025. And the stock remains down roughly 17% on the year, which makes this a rally inside a downtrend rather than a reversal of one.
Tesla belongs in this article because cars are the most interest-rate-sensitive thing a household buys. A vehicle purchase is a financing decision, and financing costs are set at the long end of the curve, which is exactly where there has been no relief. The company said as much itself on its July earnings call, when the chief financial officer noted that commodity prices and interest rate changes continue to add to costs.
The real test is October 21, when third quarter earnings are released. A delivery number tells you how many cars went out of the door. It tells you nothing about what margin they went out at, and in a quarter where financing costs stayed high, margin is the whole question.
Watch: October 21, and specifically automotive gross margin rather than the headline.
5. Coinbase: where the risk-free rate does its damage
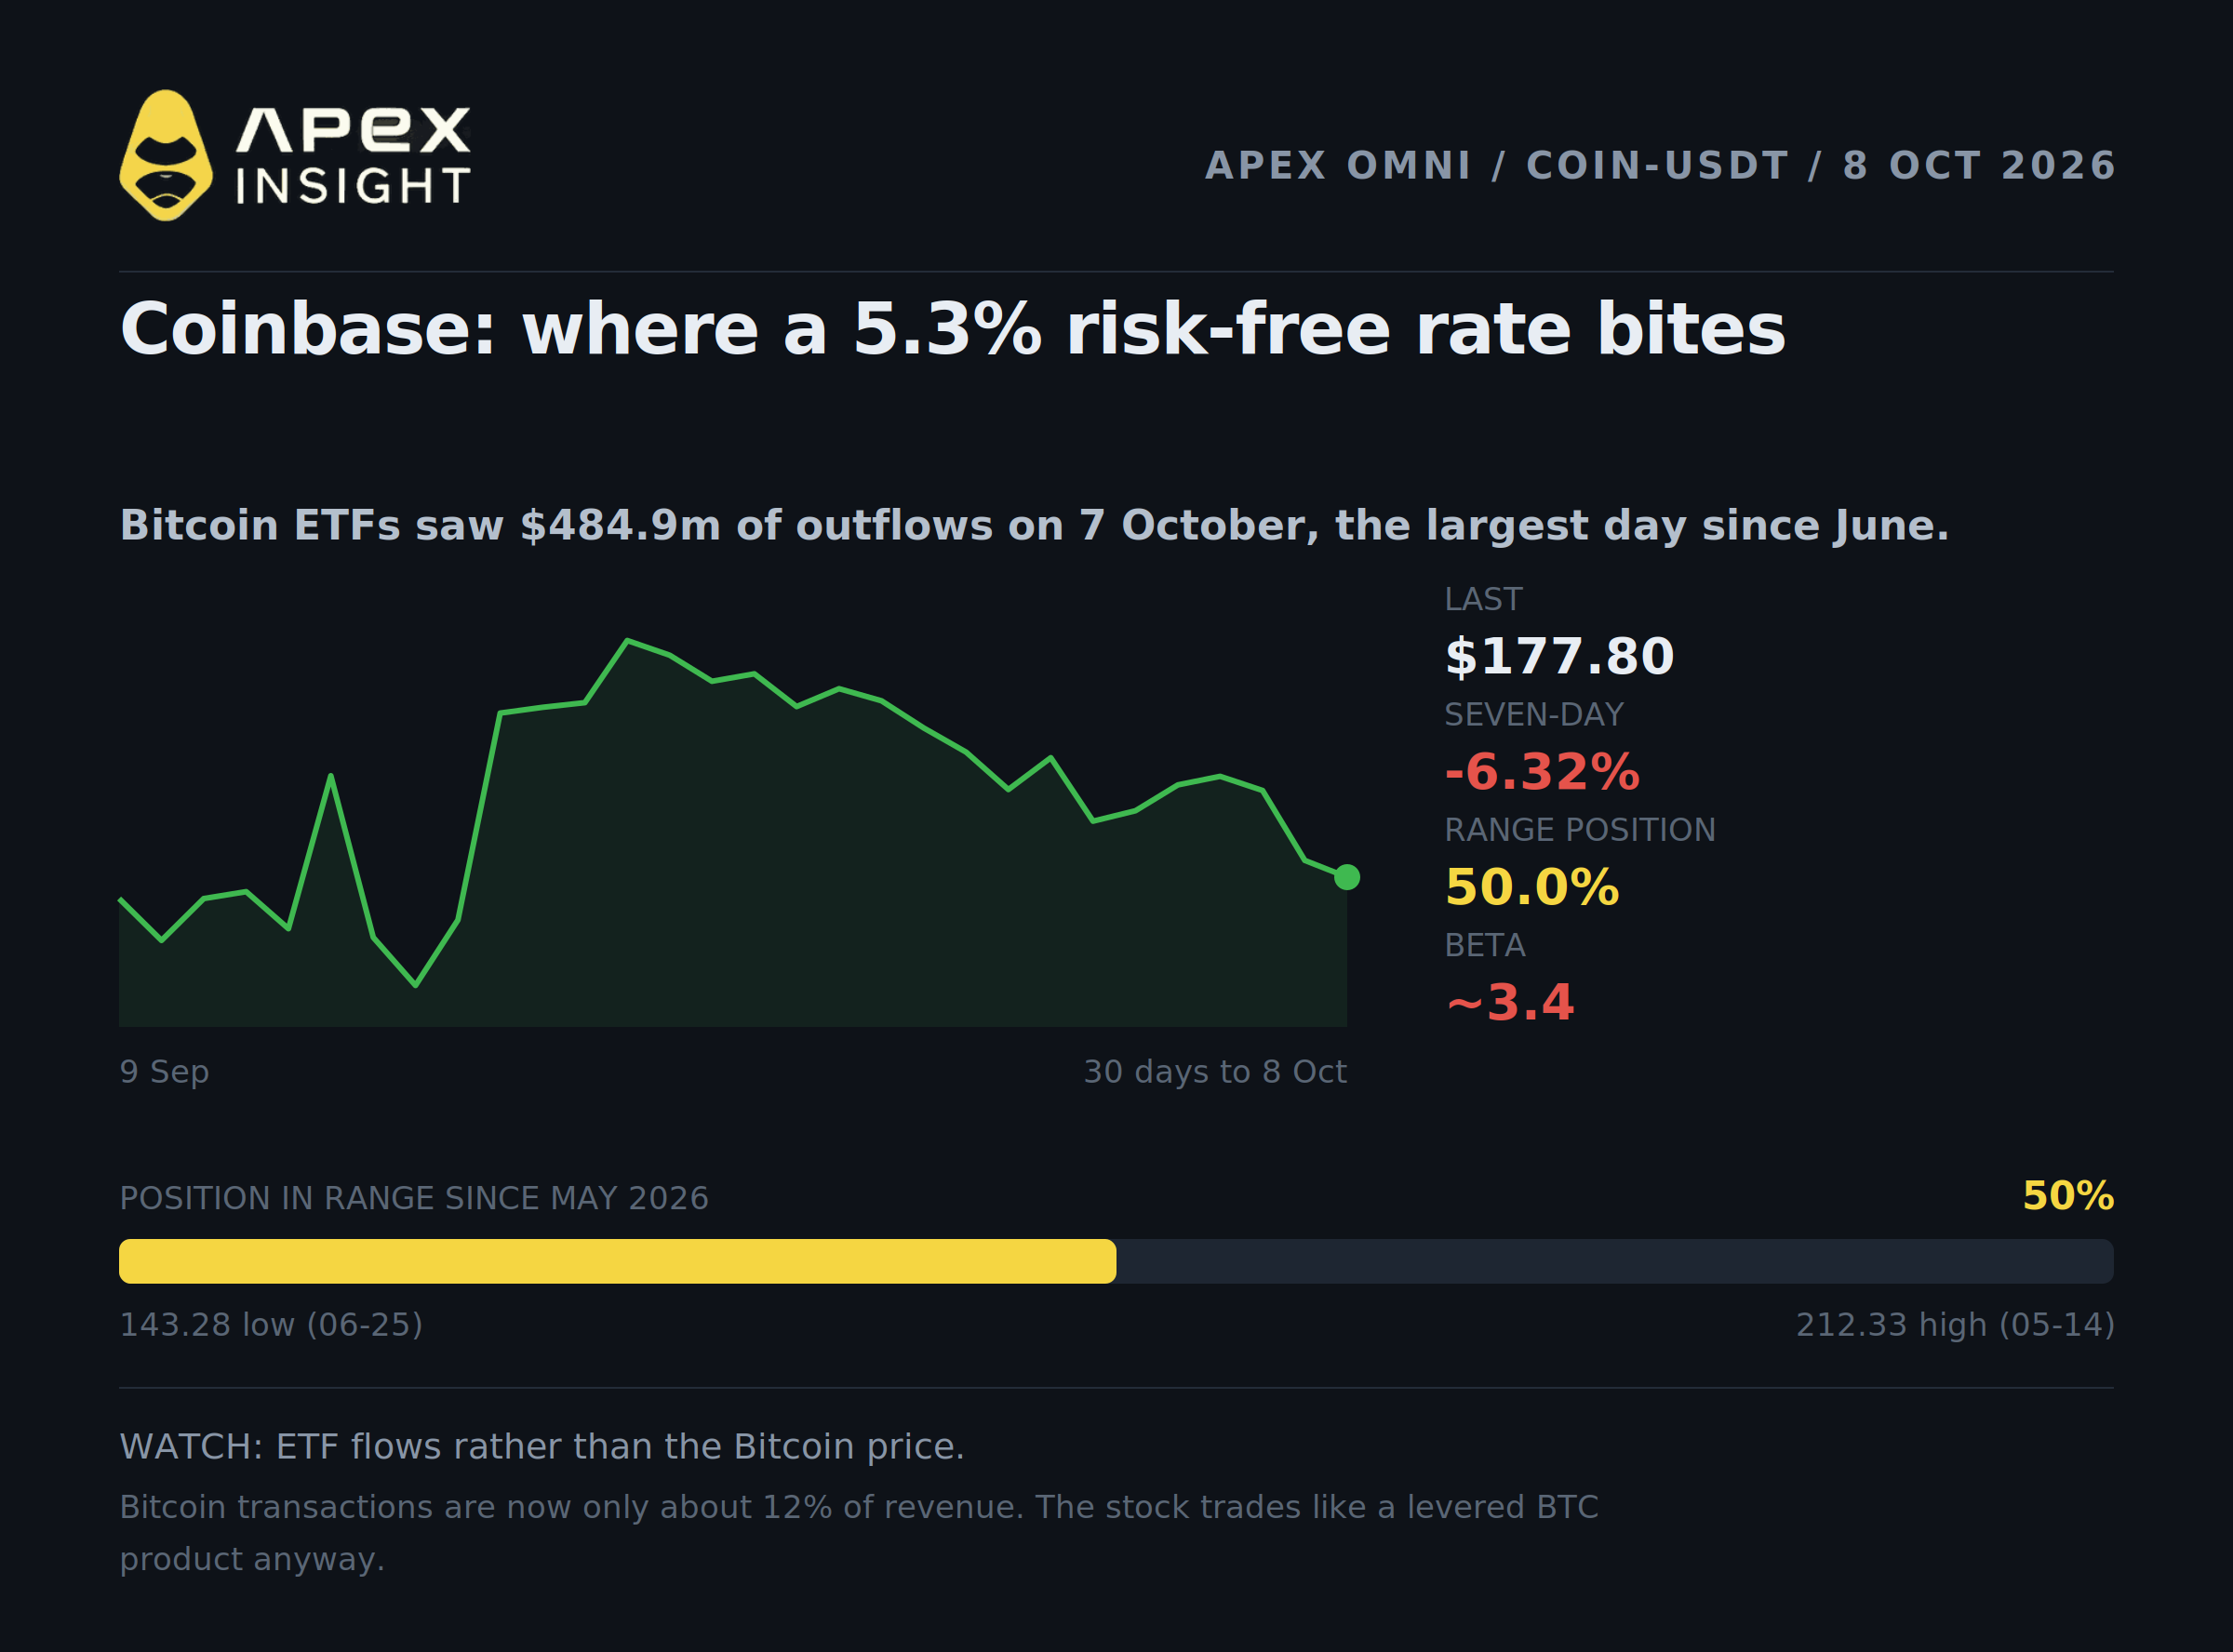
COIN-USDT, $177.80, down 2.09% on the day, 50x maximum leverage
Coinbase sits at exactly 50.0% of its range and is down 6.32% over seven days, with a beta to the market of roughly 3.4.
It is in this article because it is the cleanest expression of what a 5.3% risk-free rate does to speculative assets. Bitcoin fell through $83,000 this week and spot Bitcoin ETFs saw $484.9 million of net outflows on October 7, the largest single day since June. Roughly $547 million of leveraged positions were liquidated in 24 hours, of which about $480 million were longs.
Glassnode's read on the week is the useful one: trading volume is unusually low across both spot exchanges and ETFs, and "the market now leans on positioning more than on fresh demand." That is a thin, leveraged market with no new bid, which is what happens when the alternative pays 5.3% for no risk.
There is a genuine analyst disagreement here worth knowing. One camp argues that what matters is why yields are rising: when they rise because the Fed is tightening, Bitcoin suffers, but when they rise on fiscal and term premium concerns, it benefits. The other camp argues the distinction does not survive contact with reality, and that rising yields pull money out of risk assets regardless of cause, with crypto feeling it first.
The irony specific to Coinbase is that the company has spent two years reducing its dependence on Bitcoin. Bitcoin-linked transactions are now only about 12% of revenue, down from more than half, and subscriptions are 48% of net revenue. The stock trades like a leveraged Bitcoin product anyway.
Watch: ETF flows rather than the Bitcoin price. The flow data tells you whether money is leaving the asset class or just rotating inside it.
How to read the rest of the week
The five above are all expressions of one question: does the Fed hike again, and when?
The market's current answer is that it does, but in December rather than October. Three things between now and then will move that.
Today, 08:30 Eastern. Jobless claims. Watch continuing claims, not the headline.
October 14 and 15. September consumer price index and producer price index. The Fed's minutes said participants "had not seen sufficient progress on lowering inflation," and blamed tariffs, energy and AI-related goods prices. These two prints decide whether that language hardens.
October 27 and 28. The October FOMC meeting. Currently priced at roughly 19% for a hike. The December meeting on the 8th and 9th carries a Summary of Economic Projections, which is where the committee has to put numbers behind the language.
One framing to carry through all of it. A hiking central bank is usually a signal of an economy running hot. This one is hiking into 29,000 jobs a month because it thinks inflation is the bigger risk, with several participants recording that they view current policy as "not restrictive or only mildly restrictive" at 4%. If they are right, the long end has further to go and everything in this article reprices again. If they are wrong, the first evidence shows up in the claims data.
Trade it
All five contracts are live on ApeX Omni with up to 50x leverage.
The Daily Trading Check-In is running while you are on the board, and it pays you for showing up.
Register on the campaign page.
Trade perpetuals. Reach 5,000 USDT in perpetual volume inside a single UTC day.
Earn 10 USDT. Each qualifying day pays a 10 USDT Perpetual Trading Bonus.
The campaign closes on October 10 at 24:00 UTC, which leaves three check-ins including today. The pool is 3,000 USDT, rewards are limited each day and allocated first come, first served, and daily volume resets at 00:00 UTC with nothing carried over. Clearing your volume early in the UTC day is the difference between collecting and missing out.
The check-in counts eligible Perpetual volume. If you plan to clear it on a stock contract rather than a crypto one, confirm with ApeX support that it qualifies first.
🏆 Join: https://omni.apex.exchange/trade
📖 Read: https://www.apex.exchange/blog/detail/daily-trading-check-in-oct-2026
We appreciate your continued support.
Published by ApeX. For informational and educational purposes only. Not investment advice. Trading involves risk, including total loss. Leveraged trading carries additional risk of liquidation.