




TL;DR
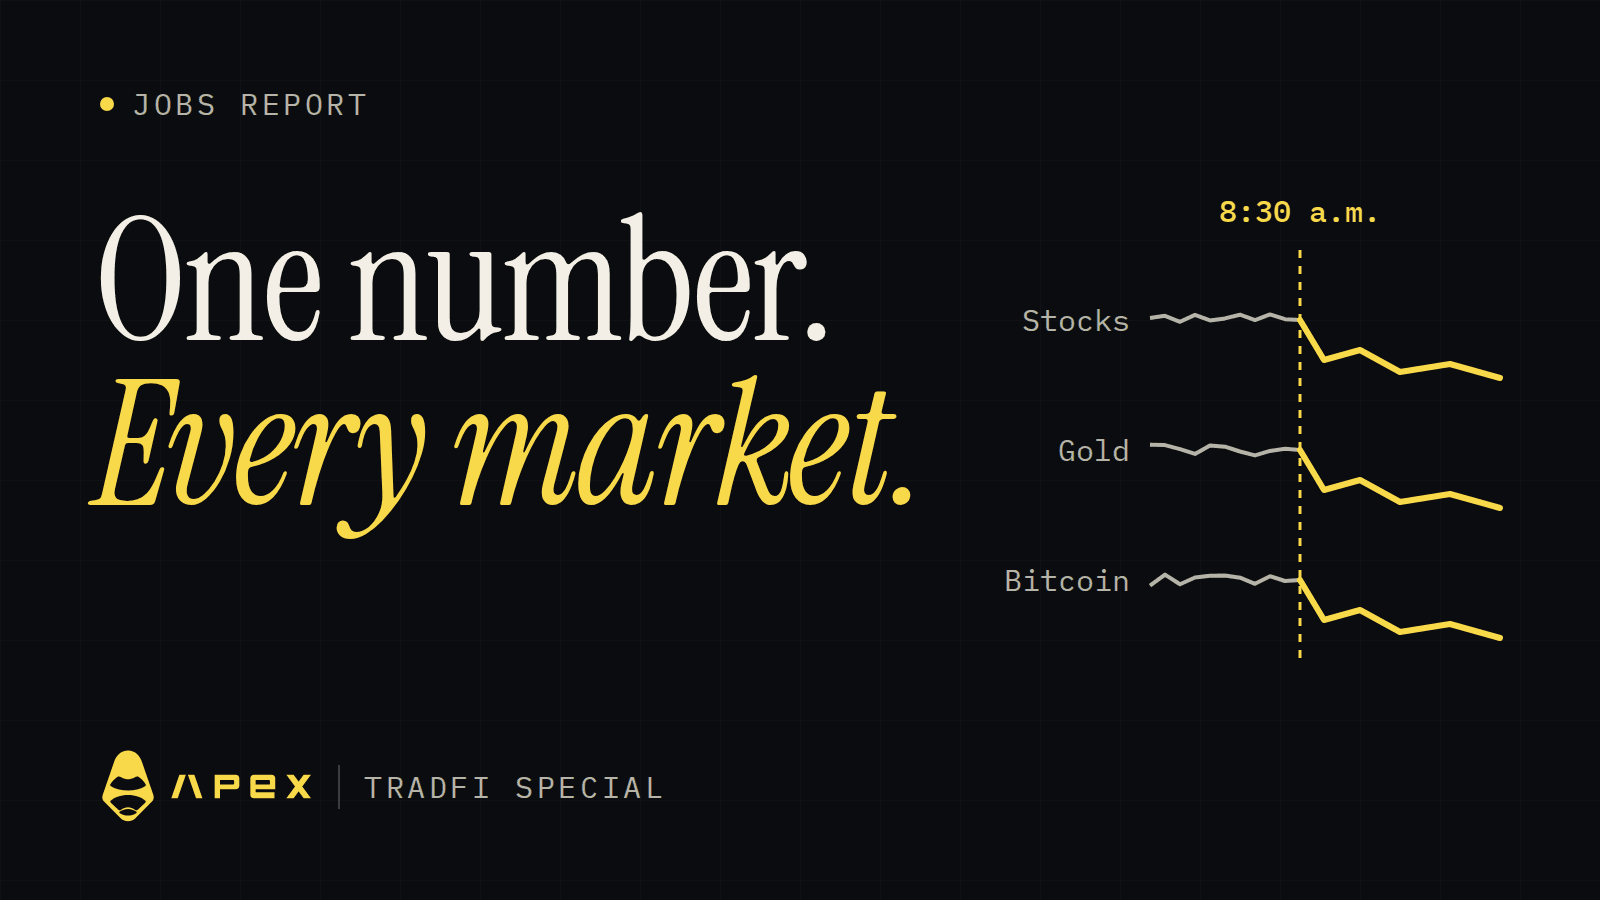
The US jobs report comes out at 8:30 a.m. New York time, usually on the first Friday of the month.
It can move stocks, gold, the dollar and crypto in the same minute, because all of them care about what the Fed does next.
If you hold several positions, they may all be the same bet on jobs day. Size for that.
From −23,000 to +162,000
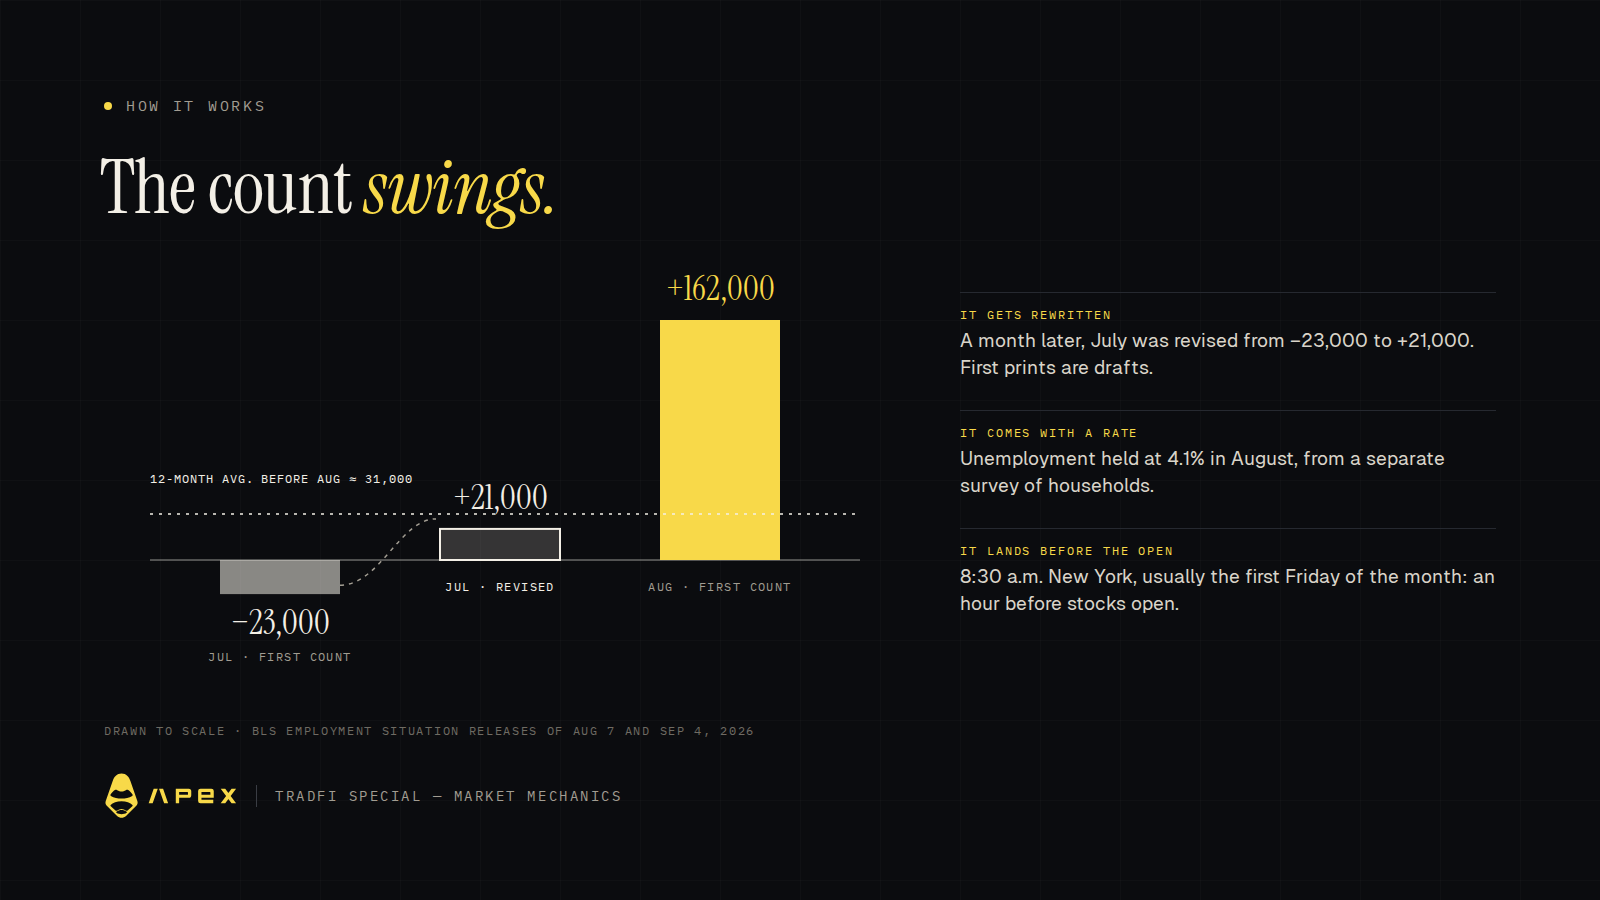
On August 7, 2026, the first count of July's jobs came in at −23,000. The US economy had, on paper, lost jobs.
A month later, on September 4, August's count came in at +162,000. The average over the prior 12 months had been about 31,000.
And the same report rewrote July: −23,000 became +21,000. The month that lost jobs on paper had actually added them.
That's why traders mark this report on their calendars. It's one number, but it swings, it surprises, and it gets rewritten.
What the jobs report is
Every month, the US Bureau of Labor Statistics publishes the Employment Situation report. Traders call it NFP, short for nonfarm payrolls.
It comes from two surveys:
A survey of businesses. It counts how many jobs were added or lost. This is the headline number.
A survey of households. It gives the unemployment rate, the share of people who want work and can't find it. In August 2026 it was 4.1%.
The report also shows average pay. Rising pay can mean more spending, and more spending can push prices up.
Think of it as the economy's monthly checkup. Heart rate, blood pressure, temperature. One visit, several readings.
Why one number moves every market
Here's the chain. Jobs affect pay. Pay affects spending. Spending affects inflation. And inflation drives what the Federal Reserve does with interest rates.
So when the report surprises, traders rethink the Fed. And almost every market cares about the Fed:
Stocks: higher rates make future profits worth less today.
Gold and silver: they pay no interest, so higher rates make them less attractive to hold.
The dollar: higher expected rates can pull money into dollars.
Crypto: it often trades with other risky assets on big data days, though not every time.
A hot report (lots of jobs, fast pay growth) can mean "rates stay higher." A cold report can mean "cuts sooner." But the market reacts to the surprise, not the number. If traders expect 150,000 and get 160,000, not much happens. If they get 20,000, a lot might.
A worked example: three trades, one bet
Say you hold three positions going into jobs day, each $1,000 at 10x leverage:
Position | Margin |
Long gold | $100 |
Long bitcoin | $100 |
Long a tech stock | $100 |
Total | $300 |
It feels spread out. Three different markets.
Now a hot report lands, and all three fall 2% within minutes. Each loses $20. Together you lose $60, which is 20% of your total margin.
On a normal day, those three might move in different directions. On jobs day, they can move together. That's the trap: it looks like three bets, but it's really one bet on the Fed. And that's before fees. A bigger move means a bigger loss.
Go deeper
Revisions. Each report revises the prior two months. Once a year, the numbers are also benchmarked to fuller state records. A big first-print surprise can shrink later. The margin of error is wide too: BLS says a monthly change needs to be about 122,000 to count as statistically significant.
Two surveys, two stories. The business and household surveys can disagree in the same month. Traders weigh the payroll count, the unemployment rate and pay growth together.
Consensus is a range. The forecast you see is an average. When forecasts are spread wide, bigger surprises are more likely.
The first minutes are thin. At 8:30 a.m. New York, the stock market is still an hour from its open. Early moves happen with fewer traders and can reverse.
Friday timing. Stock pairs that trade 24/5 pause for the weekend. Anything you hold into Friday's close can open at a different price after the break.
What this means for traders
Convert the time. 8:30 a.m. New York is 20:30 in Singapore and Hong Kong (UTC+8) while New York is on summer time, and 21:30 in winter.
Check the forecast first. Know what "surprise" would mean before the number lands.
Count your real exposure. Add up every position that loses if rates are expected to rise.
Leave room for the swing. Leverage that's fine on a quiet day can get liquidated in minutes.
Don't trust the first print too much. It will be revised.
Live now on ApeX: TradFi Showdown
ApeX's TradFi section lists perpetual futures on gold, silver, oil and US stocks, priced by Chainlink oracle feeds. Gold, silver and the CLUSDT oil contract trade 24/7. Most stock pairs trade 24/5 and pause on weekends and US holidays. TradFi has its own balance, funded by a transfer. Up to 50x leverage, no KYC, self-custody. This week: the September jobs report lands on Fri Oct 2 at 8:30 a.m. New York (20:30 UTC+8).
• Runs until Oct 3, 08:00 UTC. Registration required.
• Trade $5,000, $20,000 or $50,000 in TradFi volume to earn a $5, $15 or $30 TradFi Trading Bonus. Tiers don't stack.
• 3,000 USDT pool, first come, first served.
Glossary
Jobs report (NFP): the monthly US count of jobs added or lost, plus the unemployment rate and pay.
Nonfarm payrolls: jobs at US businesses and government, excluding farm work.
Unemployment rate: the share of people who want a job and can't find one.
Consensus: the average forecast from economists before a release.
Revision: an update to an earlier month's number as more data comes in.
Correlation: when prices tend to move together.
Leverage: trading a bigger position than your own money covers.
Margin: the money you put up to open a leveraged position.
Liquidation: when a leveraged position is closed automatically because losses have used up the margin.
This article is for education only and is not financial advice. Trading perpetual futures with leverage carries a high risk of loss, including your full margin. Prices can move sharply around economic data. Do your own research.