

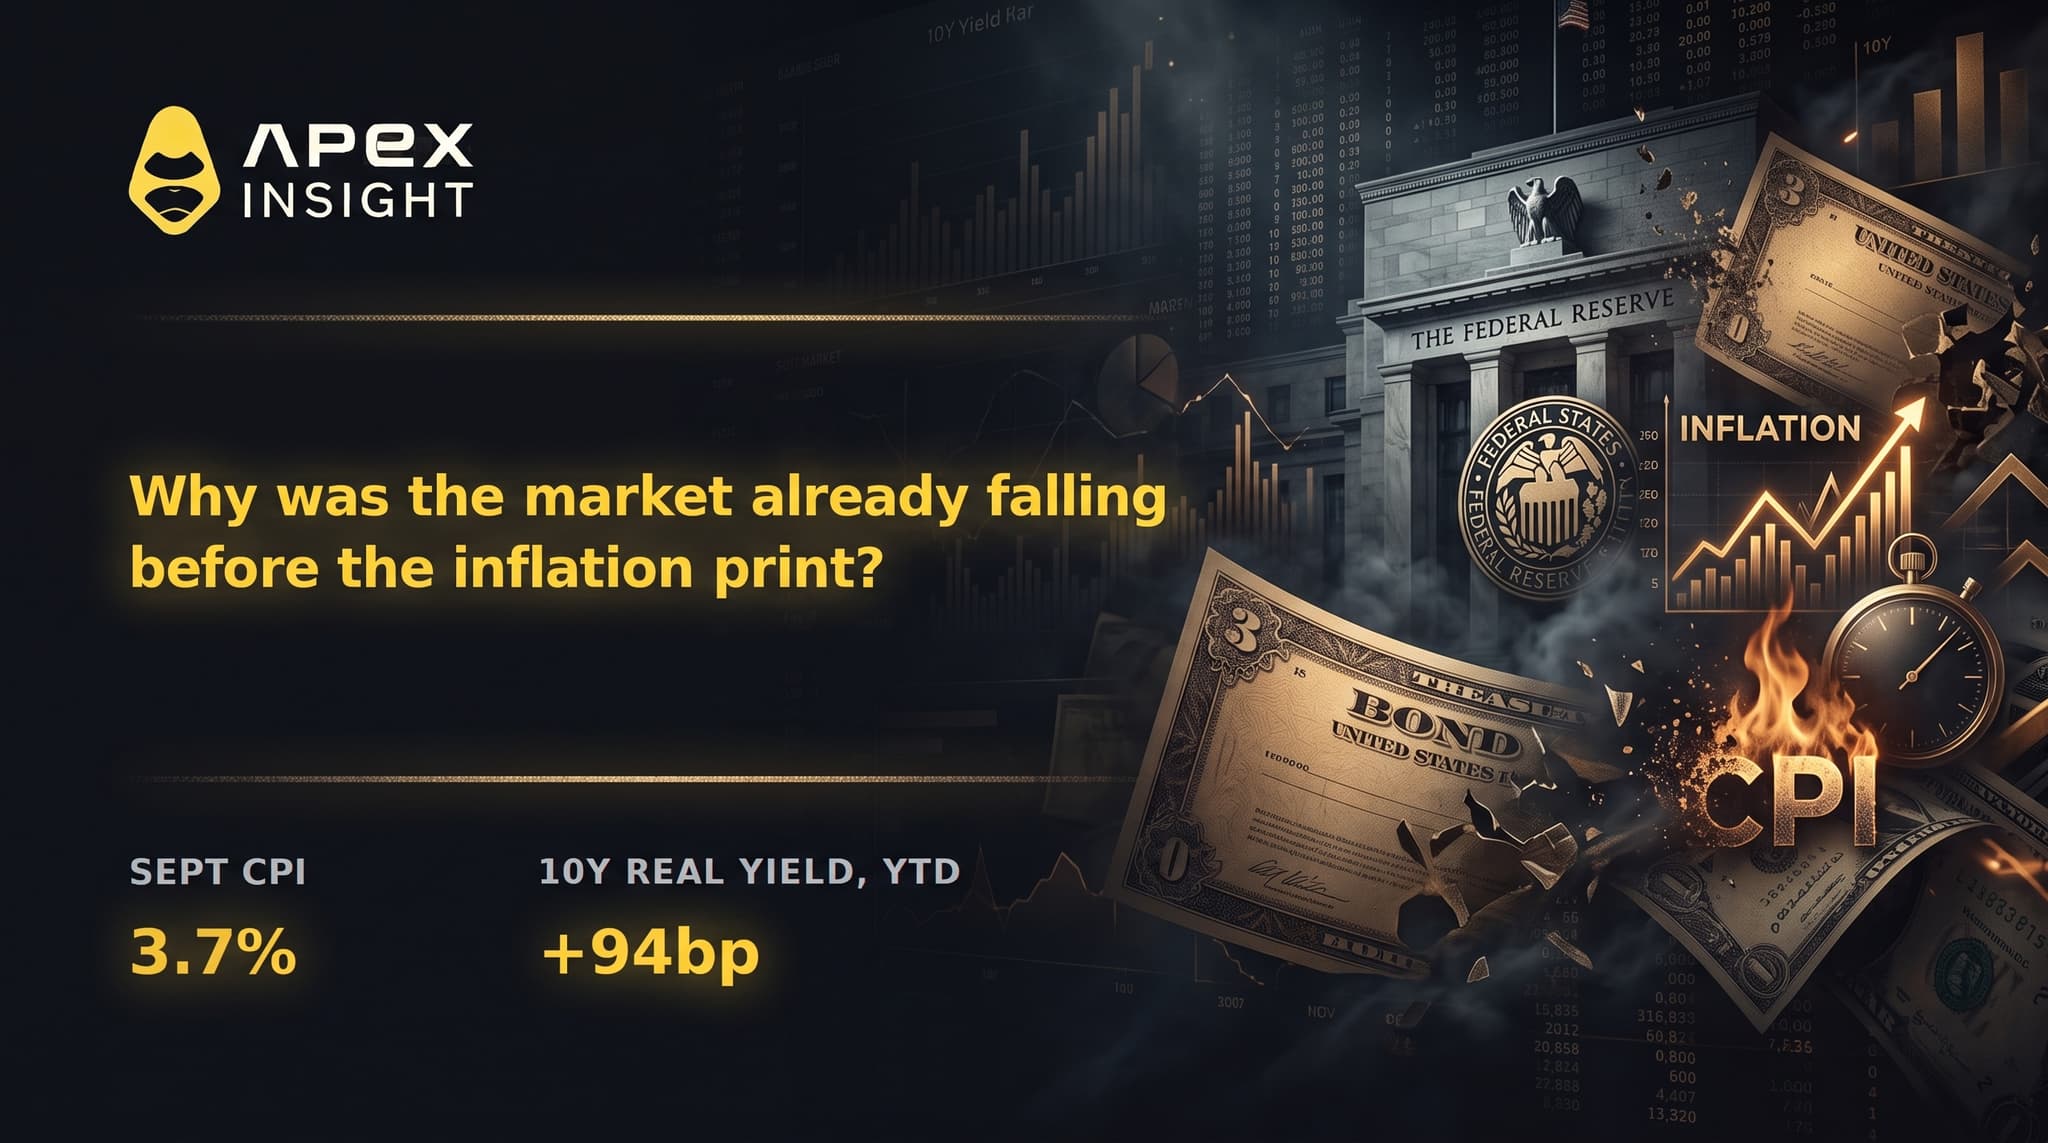


The September CPI report landed at 12:30 UTC on Wednesday and it was hot. Headline inflation came in at 3.7% year on year against a 3.6% forecast, up from 3.4% in August. Core came in at 2.6% against 2.5% expected, up from 2.4%. Month on month the headline rose 0.6%, which was in line, and core rose 0.3% against 0.2% expected.
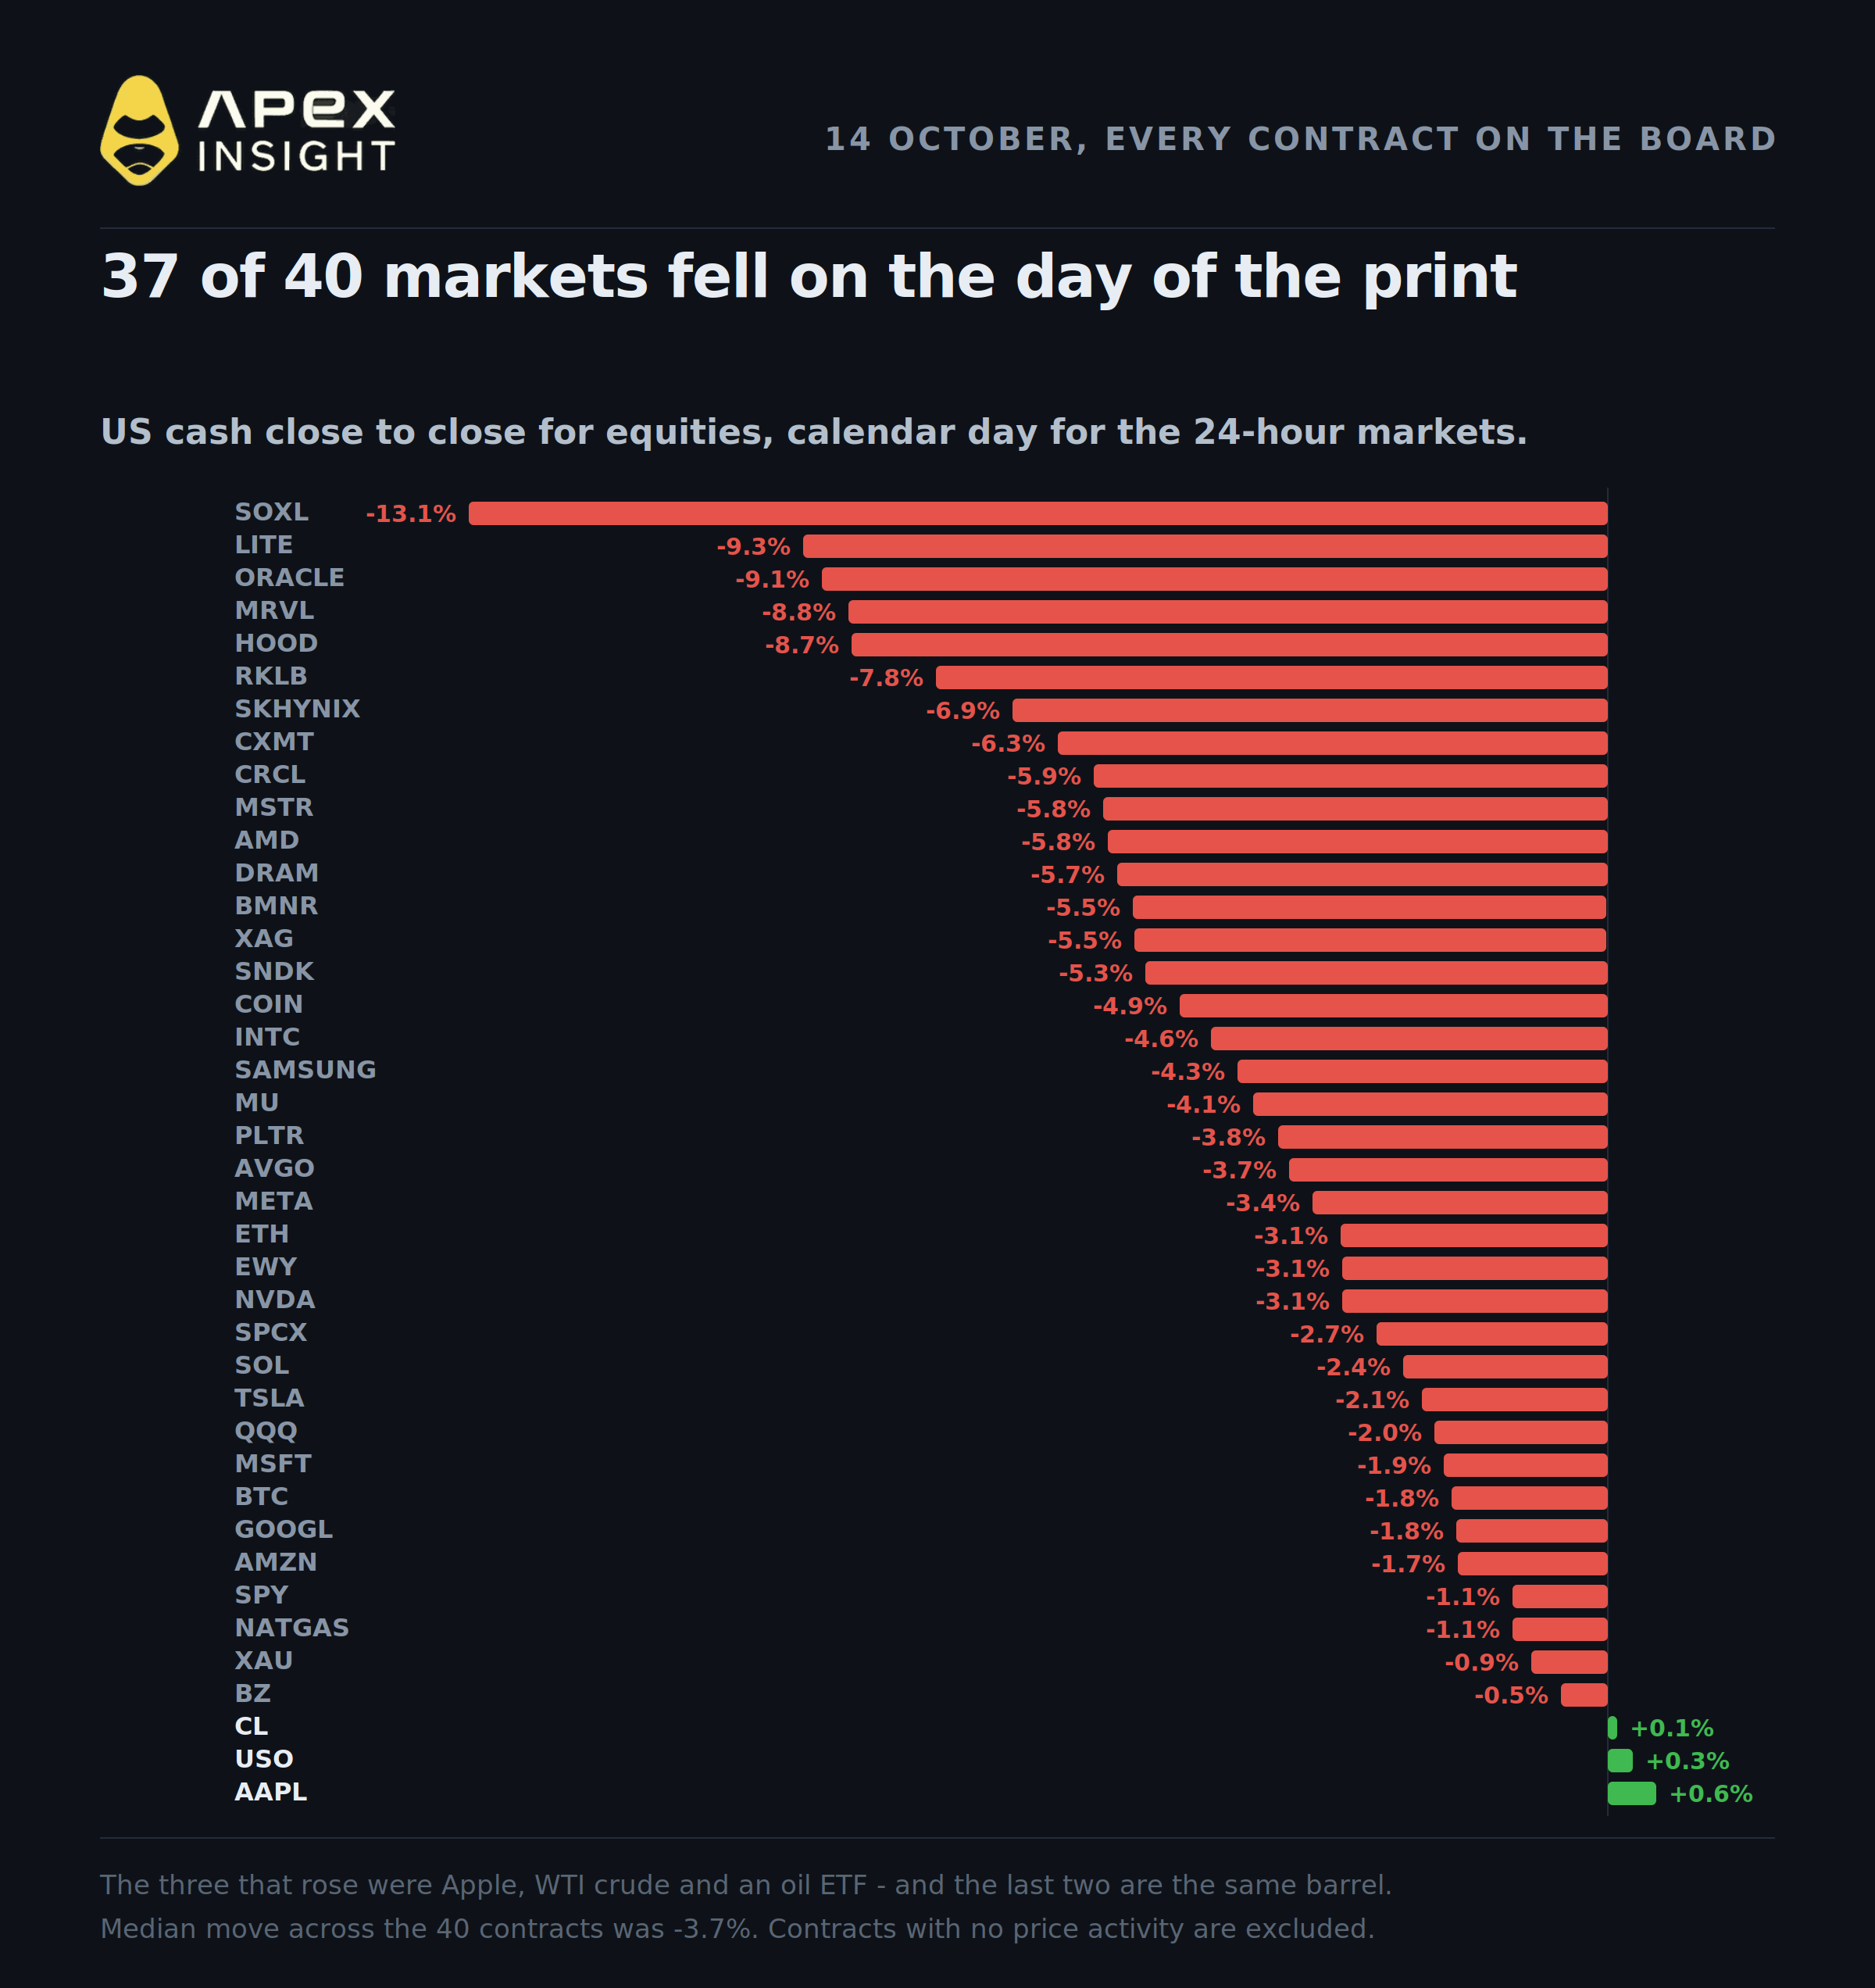
Markets then had one of the worst sessions of the year. Measured across the ApeX board, excluding contracts with no price activity, 37 of 40 fell, with a median loss of 3.7%. The three that did not were Apple, WTI crude and an oil ETF — and the last two are the same barrel.
The two facts were duly joined together. Hot inflation, hawkish Fed, everything falls.
The trouble is that the story does not survive contact with the tape on either side of it.
What the print actually said
The detail matters, because the headline and the surprise are two different things.
Component | Month on month | Year on year |
|---|---|---|
Headline CPI | +0.6% | 3.7% |
Core CPI | +0.3% | 2.6% |
Energy | +5.2% | +20.4% |
Gasoline | +9.1% | +34.2% |
Fuel oil | +15.3% | +74.2% |
Shelter | +0.4% | +3.2% |
Airline fares | +1.2% | +22.4% |
Food | 0.0% | +2.5% |
The Bureau of Labor Statistics noted that gasoline alone accounted for more than half of the entire monthly increase, up from about a third in August.
That is the headline, and the market had it priced. A tenth of a point on a gasoline-driven headline is a non-event. The surprise was underneath it, and it was not energy at all:
Core rose 0.33% unrounded against 0.20% expected, the largest monthly core gain in months
Core services excluding housing has run at a 4.5% annualised pace over three months, across roughly two-thirds of the basket
Core goods rose 0.3% on the month, against a year-on-year rate of just 0.7% — the monthly pace has turned
Supercore, core services excluding housing, rose about 0.3% on the month
Owners' equivalent rent re-accelerated to 3.3% year on year, from 3.1%
The three-month annualised core rate jumped to 3.4% from 2.0%
Omair Sharif of Inflation Insights called the surprise "broad-based rather than concentrated in one item." Citi moved to forecasting a December hike and said so explicitly: price pressures had spread beyond energy, which makes it harder for the Fed to look through them.
That is the actual news in this report. The energy shock has stopped being a thing the Fed can describe as a relative-price move and started showing up in the services and goods that monetary policy is supposed to control. The pass-through is the story, not the gasoline.
What it did to rates
The reaction in rates is the most misreported part of the day, and it is worth getting exactly right.
The ten-year spiked to 5.30% on the print, up about 8 basis points, and the two-year jumped 10 basis points to 4.89%. The dollar ran to 102.90, its highest since April 2025.
Then the long end gave it all back. The ten-year closed at 5.190%, down 2.7 basis points on the day. The thirty-year closed down 3.8 basis points. Only the front end finished higher at all, and even there the two-year gave back most of its spike.
That is a twist flattener, and it is not what an inflation scare looks like. If the market had read this print as inflation getting away from the Fed, long yields and breakevens would have risen together and stayed up. Instead the curve priced more tightening and less growth — the Fed will hike, and the economy will pay for it.
Fed pricing moved the same way, violently and then partially back. October hike odds went from roughly 20% before the print to about 50% at the intraday peak, settling near 34-40% by mid-afternoon. December sits around 63%. Different vendors published figures across that range at different minutes of the day, which is itself the point: this was a repricing that spiked and faded within a single session.
Richmond Fed president Tom Barkin, the only official on the record after the release, said the print "was higher than I would have hoped" and pointedly declined to signal October: "I do not want to project the outcome of the October FOMC meeting."
So the macro event is real. It is simply not what did the damage to equities.
What the print can and can't explain
Start with what it can. The print hour was the worst hour of the day for the chips and for silver, it doubled the odds of an October hike at the peak, and it pushed Citi to forecast a December move. Nobody should pretend a 0.33% core reading against 0.20% expected is noise.
Now what it can't.
1. The selling was five sessions old when the print landed.
The Philadelphia Semiconductor Index fell 2.7% on Monday 12 October — its fifth consecutive decline — and was working on a sixth by Tuesday. By the time CPI was released the index was already more than 7% below its early-October high. A catalyst cannot explain moves that happened before it.
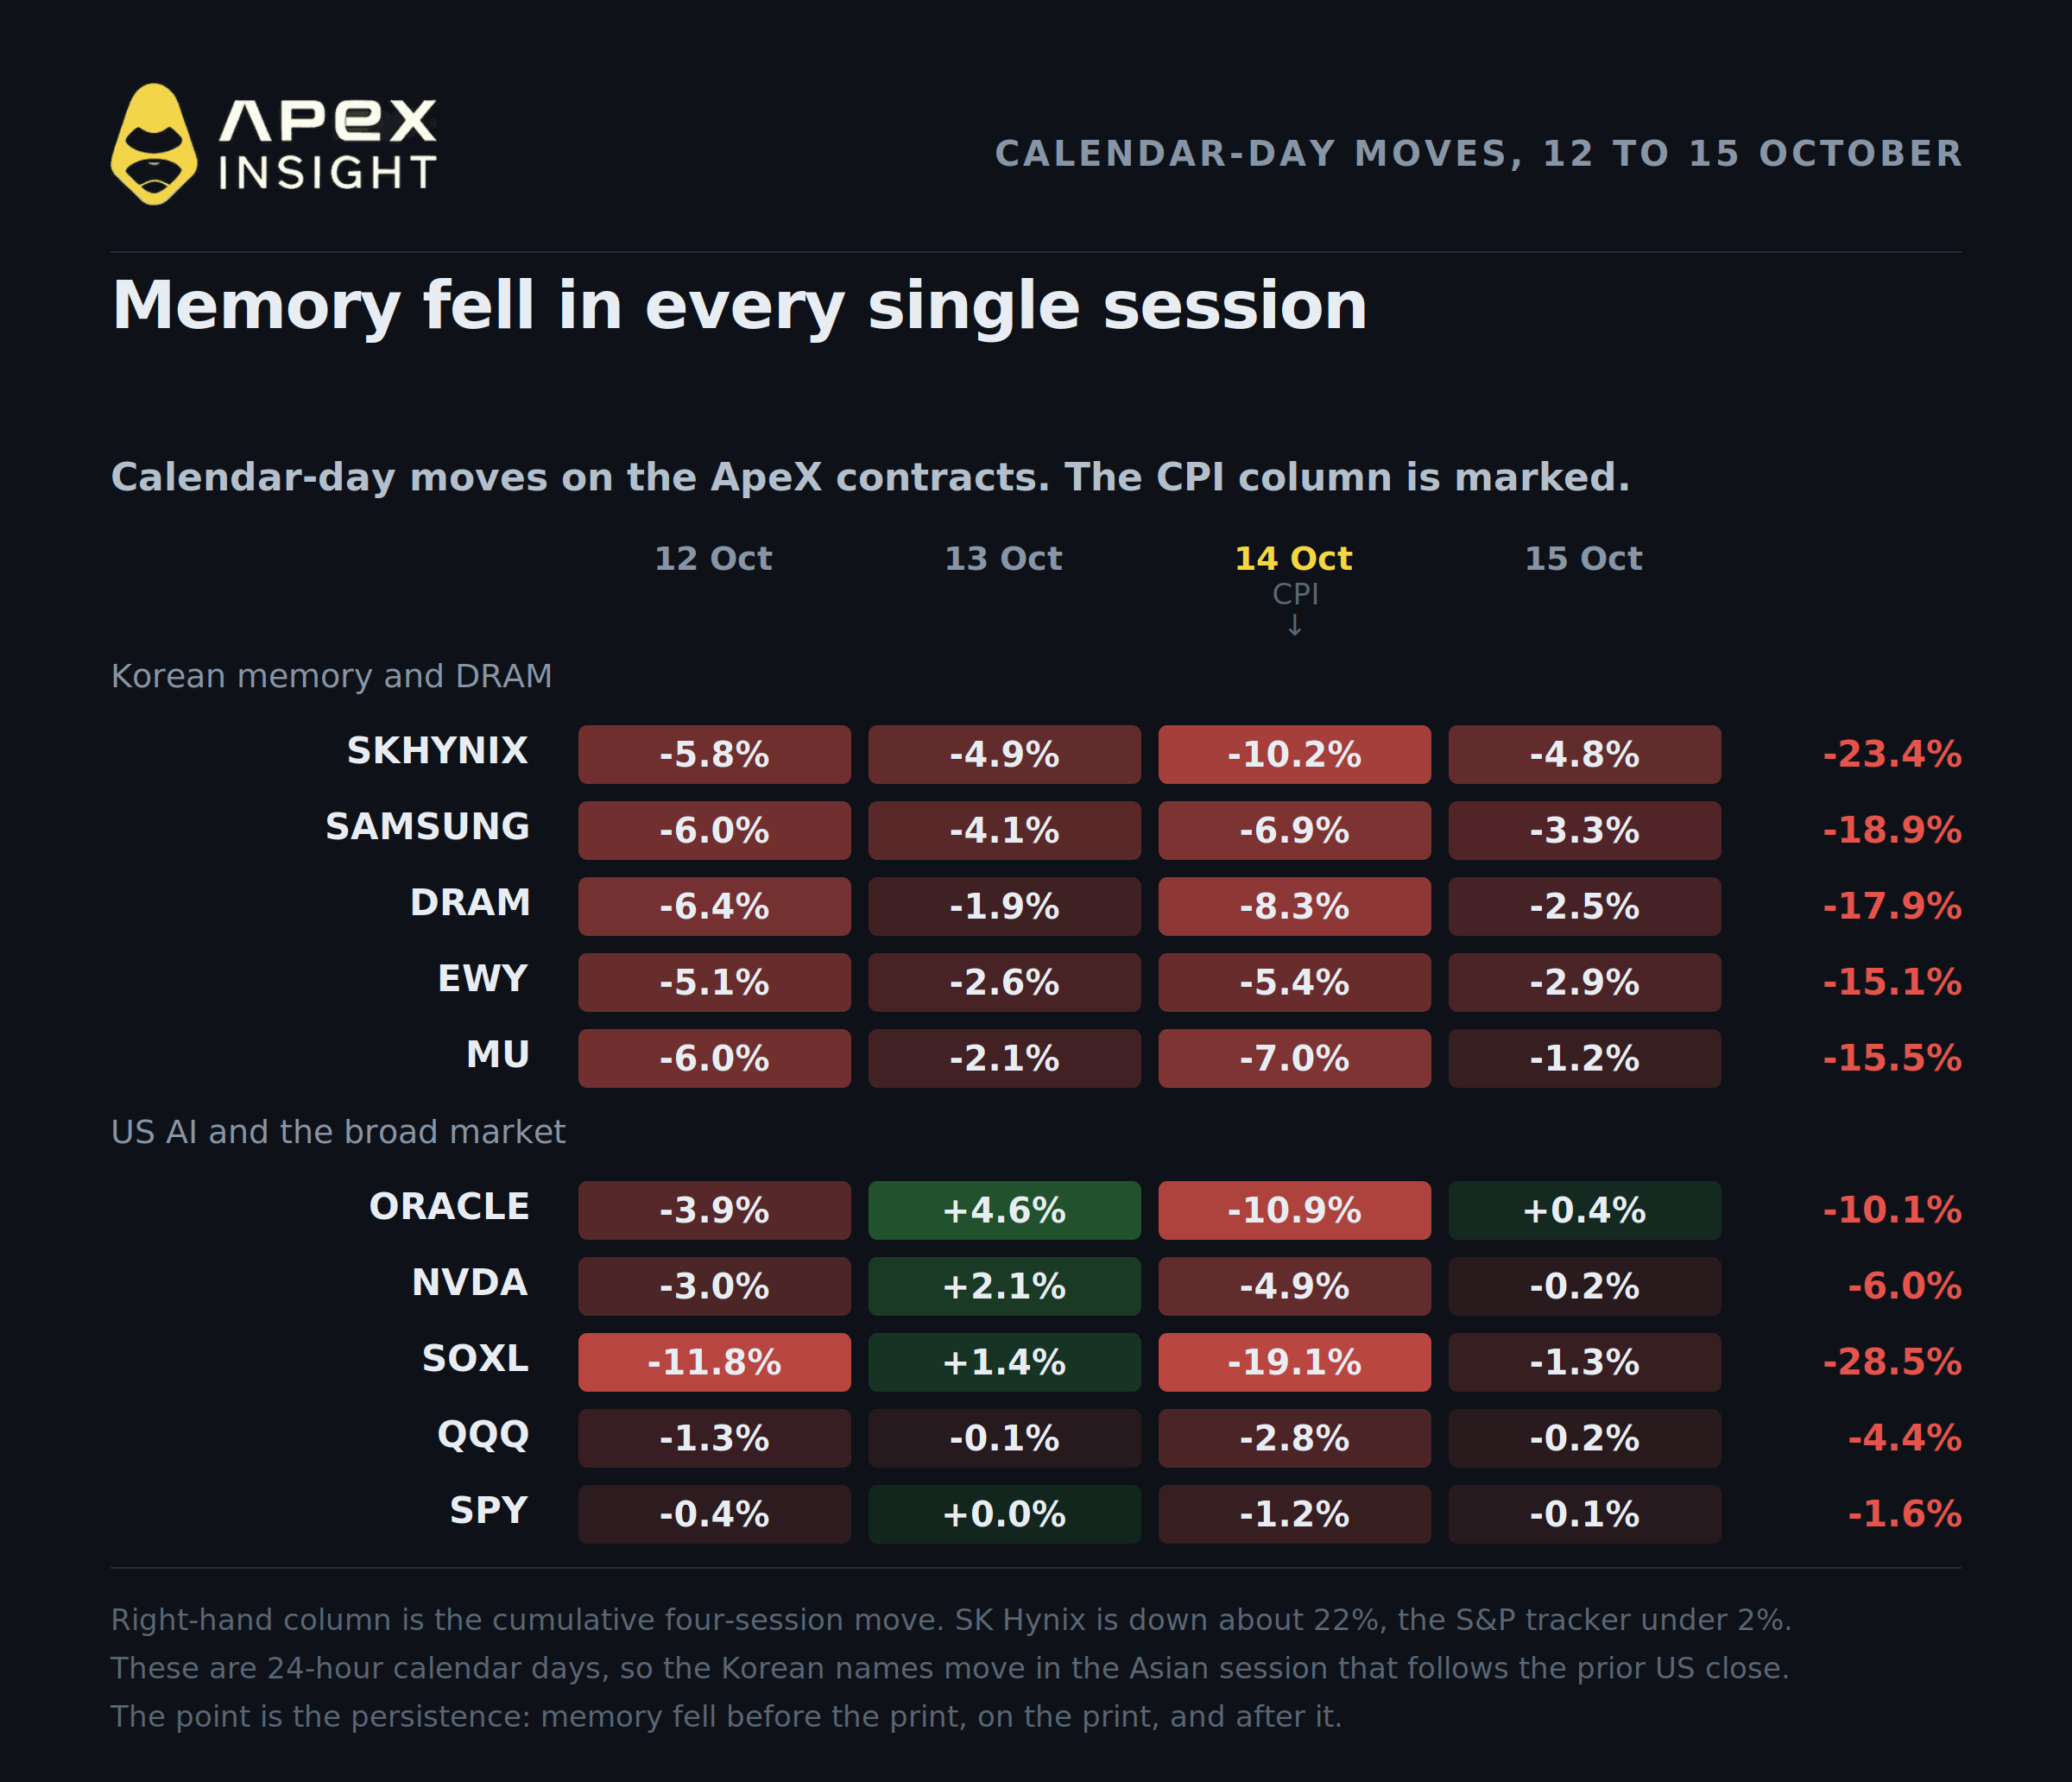
2. The memory complex has fallen in every session since, and the damage is wildly asymmetric.
From the close of 11 October to now, SK Hynix is down about 22%, Samsung 19%, Micron 15% — against the S&P tracker's under 2%. Those names fell before the print, on the print, and after it, without a break.
A caveat on reading this, because it matters: these are 24-hour calendar days, and the Korean names do their moving in the Asian session, which follows the previous US close. So part of any given Korean day is a reaction to the American one before it. What the sequence shows is not two markets moving in opposite directions at the same moment — in the hours when both actually traded on 13 October, they rose together. What it shows is persistence: a complex that kept losing ground across four consecutive sessions, through a macro event that should have been a one-day shock.
And it did not stop. Into Thursday the Kospi fell 7.6%, halted for twenty minutes by a circuit breaker, and the Nikkei 4.9%, with SK Hynix down 11.1% and Samsung 9.5% on foreign net selling of ₩3.6trn.
3. The rotation was sectoral, not market-wide.
A repricing of all future cash flows hits everything with duration. This did not. On Wednesday the best sector in the S&P 500 was health care, up about 2.5%, with consumer staples and energy also higher. Information technology fell about 3%, and the semiconductor ETF 4.0%. The Dow closed down 0.09% while the Nasdaq Composite lost 1.88% — a spread of nearly 180 basis points, with money visibly moving rather than leaving.
4. The inflation hedges refused to confirm it.
Gold fell about 1.5% in spot terms, silver 6%, copper 1.7% and bitcoin about 2% — all on a hot inflation report. Long yields closed lower and breakevens did not run. When a print genuinely frightens a market about the price level, the inflation hedges go up. These went down with everything else, which is the signature of a liquidation rather than an inflation scare — the same thing that was happening to equities, not a separate phenomenon.
5. Good news was sold.
Lumentum fell around 10% while its chief executive was on record saying capacity is "completely sold out" through early 2029. ASML reported solid results on the same day and raised its sales forecast, and fell anyway. Marvell fell while new AI interconnect chips were entering customer sampling. When fundamentally improving companies fall together, you are watching positioning unwind, not cash flows being discounted differently.
What actually happened
Two things, neither of them macro.
A Chinese memory disclosure, 10 October. At a conference in Shanghai, the president of China's ChangXin Memory Technologies said its first 4F² DRAM product — a denser cell architecture incumbents have chased for years — would be a server-grade DDR5 module shipping before the end of 2026. Server DDR5 is the highest-margin part of the market. CXMT's DRAM share has gone from about 4% to 10% in a year, against Samsung at 38%, SK Hynix at 25% and Micron at 24%.
Samsung and SK Hynix each fell more than 4% on Monday the 12th. Then on Tuesday the 13th SK Hynix fell 10.1% and Samsung 7.4%, with the Kospi down 5.5% on ₩4.5trn of foreign net selling. This is a supply threat to one industry and it has nothing to do with the Federal Reserve.
The sell side is not convinced the threat is near-term — Mizuho's Jordan Klein noted that "a launch doesn't establish manufacturing maturity, yields, or cost competitiveness" — but the market did not wait for the argument.
An AI credit repricing, 14 October. On the day of the CPI print, two separate things hit the financing side of the AI trade. A CoreWeave bond issued in June at a 9.625% coupon was shown changing hands at a 15% yield, prompting a public exchange in which Chamath Palihapitiya warned of a private credit bubble and Elon Musk replied "Yikes." Separately, Gartner published a note predicting that 80% of neoclouds could disappear by 2030 and that more than $3.5trn of AI infrastructure spending could be exposed to impairment.
CoreWeave closed down 15.5% on volume 263% above average. Nebius fell 10%.
The context had been building for days: the IMF's Global Financial Stability Report on the 13th warned that an AI correction "could be global" and flagged circular financing among firms that are simultaneously each other's investors, financiers and customers. BlackRock cut US equities to neutral on the 12th. Goldman Sachs has counted roughly $489bn of AI-related debt issued this year against a $322bn forecast; hyperscaler gross leverage has gone from about 0.9x to 1.8x in six months.
Nobody has cut capex. What has changed is the price of funding it.
The two names people got wrong
Oracle fell 9.1%, and it is a spread story, not a rate story. Oracle carries $129.5bn of notes and other borrowings, or about $167bn once operating and finance leases are counted, and reported a free cash flow deficit of $23.7bn for FY2026 — operating cash flow of $32.0bn against capex of $55.7bn. OpenAI accounts for around half of its $638bn of remaining performance obligations and is not required to pay for its data centre capacity before 2027. S&P cut the company to BBB− on 9 July, one notch above junk, explicitly citing that concentration.
When comparable AI paper clears at 15% and a research house writes that $3.5trn of infrastructure spend may be impaired, that is a widening credit spread, and for a borrower this leveraged the spread does more to the equity than the risk-free rate does. Oracle fell 8.8% in cash terms on a day the ten-year closed lower — and it did most of its damage after the US open rather than on the data itself.
Apple rose 0.6%, and not because it is short-duration. Apple closed above $5trn of market capitalisation for the first time, only the second company ever to do so, on its iPhone 18 Pro cycle and a 13 October launch of the HomeView smart home hub and three other products. It had crossed $5trn intraday six times before without holding it.
The tempting explanation — that Apple is the shortest-duration mega-cap and therefore the natural hedge in a rate shock — has the sign wrong on the most relevant channel. Apple buys memory. Rising DRAM prices are a cost problem for it, and that is not a forecast: Apple is reported to have cut October iPhone 18 Pro component orders by at least 15%, citing softer demand, higher memory costs and $100 price increases. It rose on a milestone, not on duration.
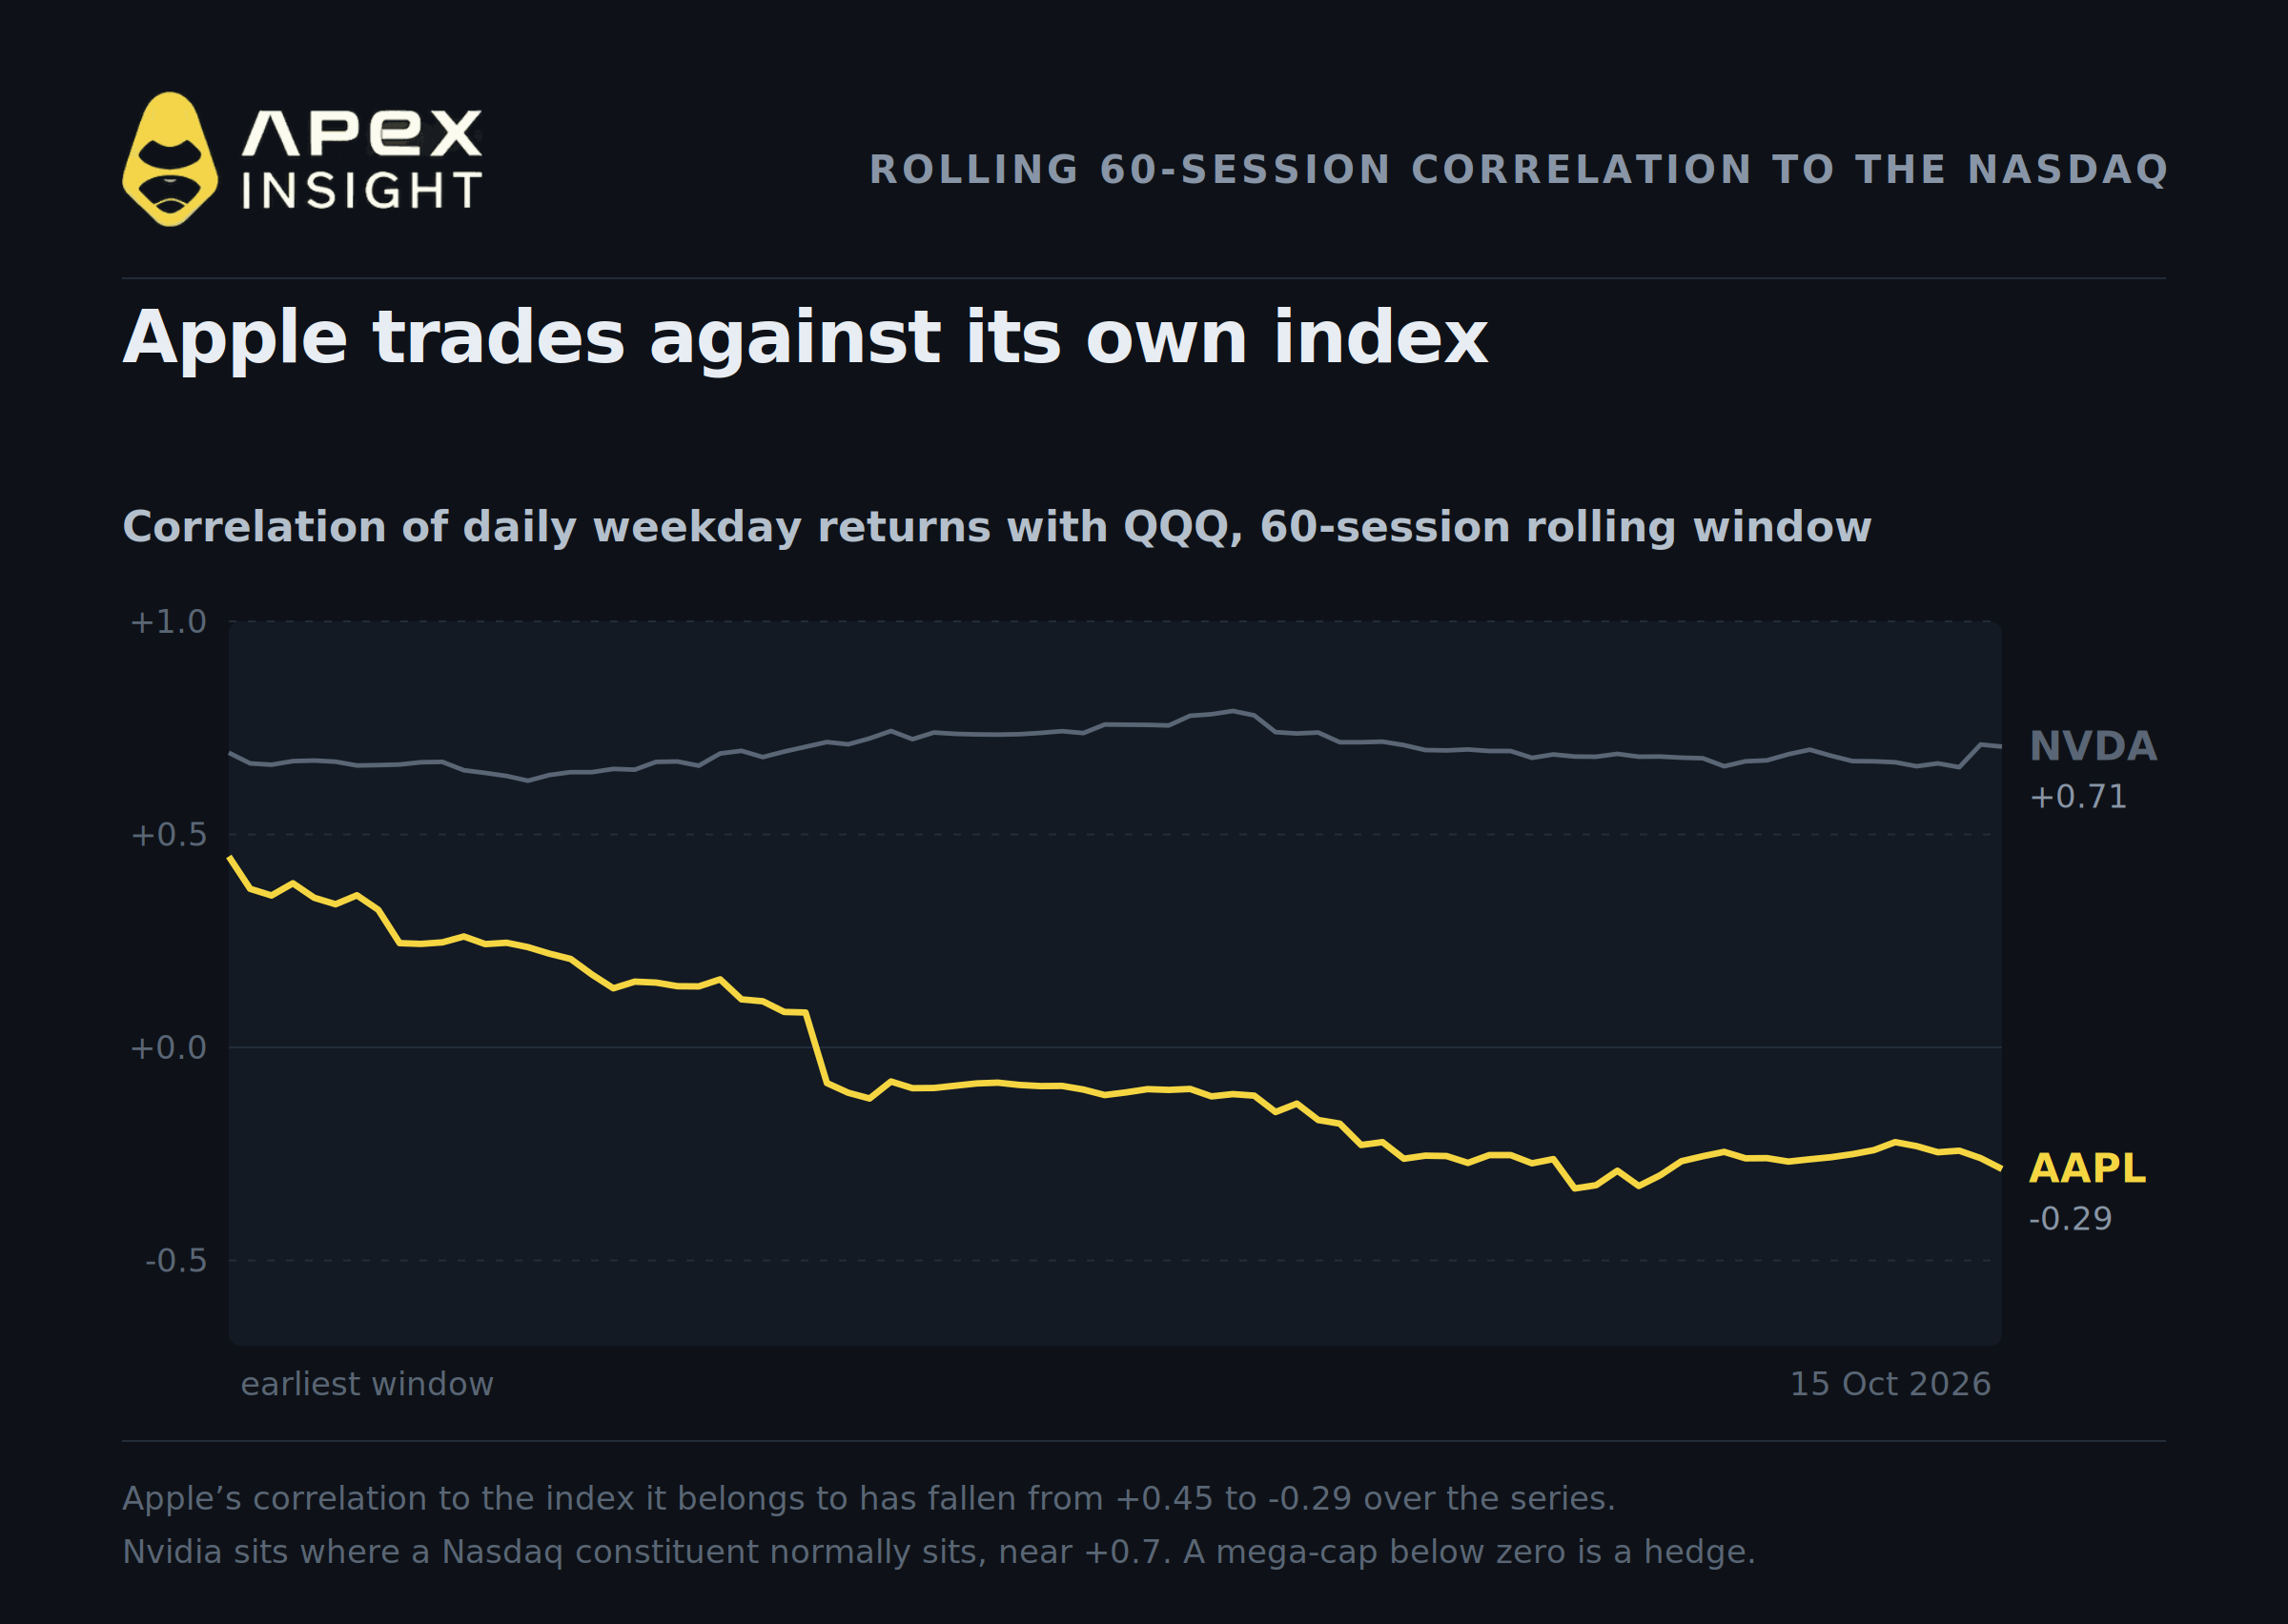
What is true, and measurable, is that Apple has stopped behaving like a member of its own index. Its 60-session correlation to the Nasdaq proxy has fallen from +0.45 in the earliest window we can compute, which ends in June, to −0.29 today, while Nvidia sits at +0.71, which is where an index constituent normally sits. That is why it was the only large-cap standing, whatever the proximate reason for the gain.
What CPI did move
Strip out the equity complex and the print's fingerprints are clear, in two places.
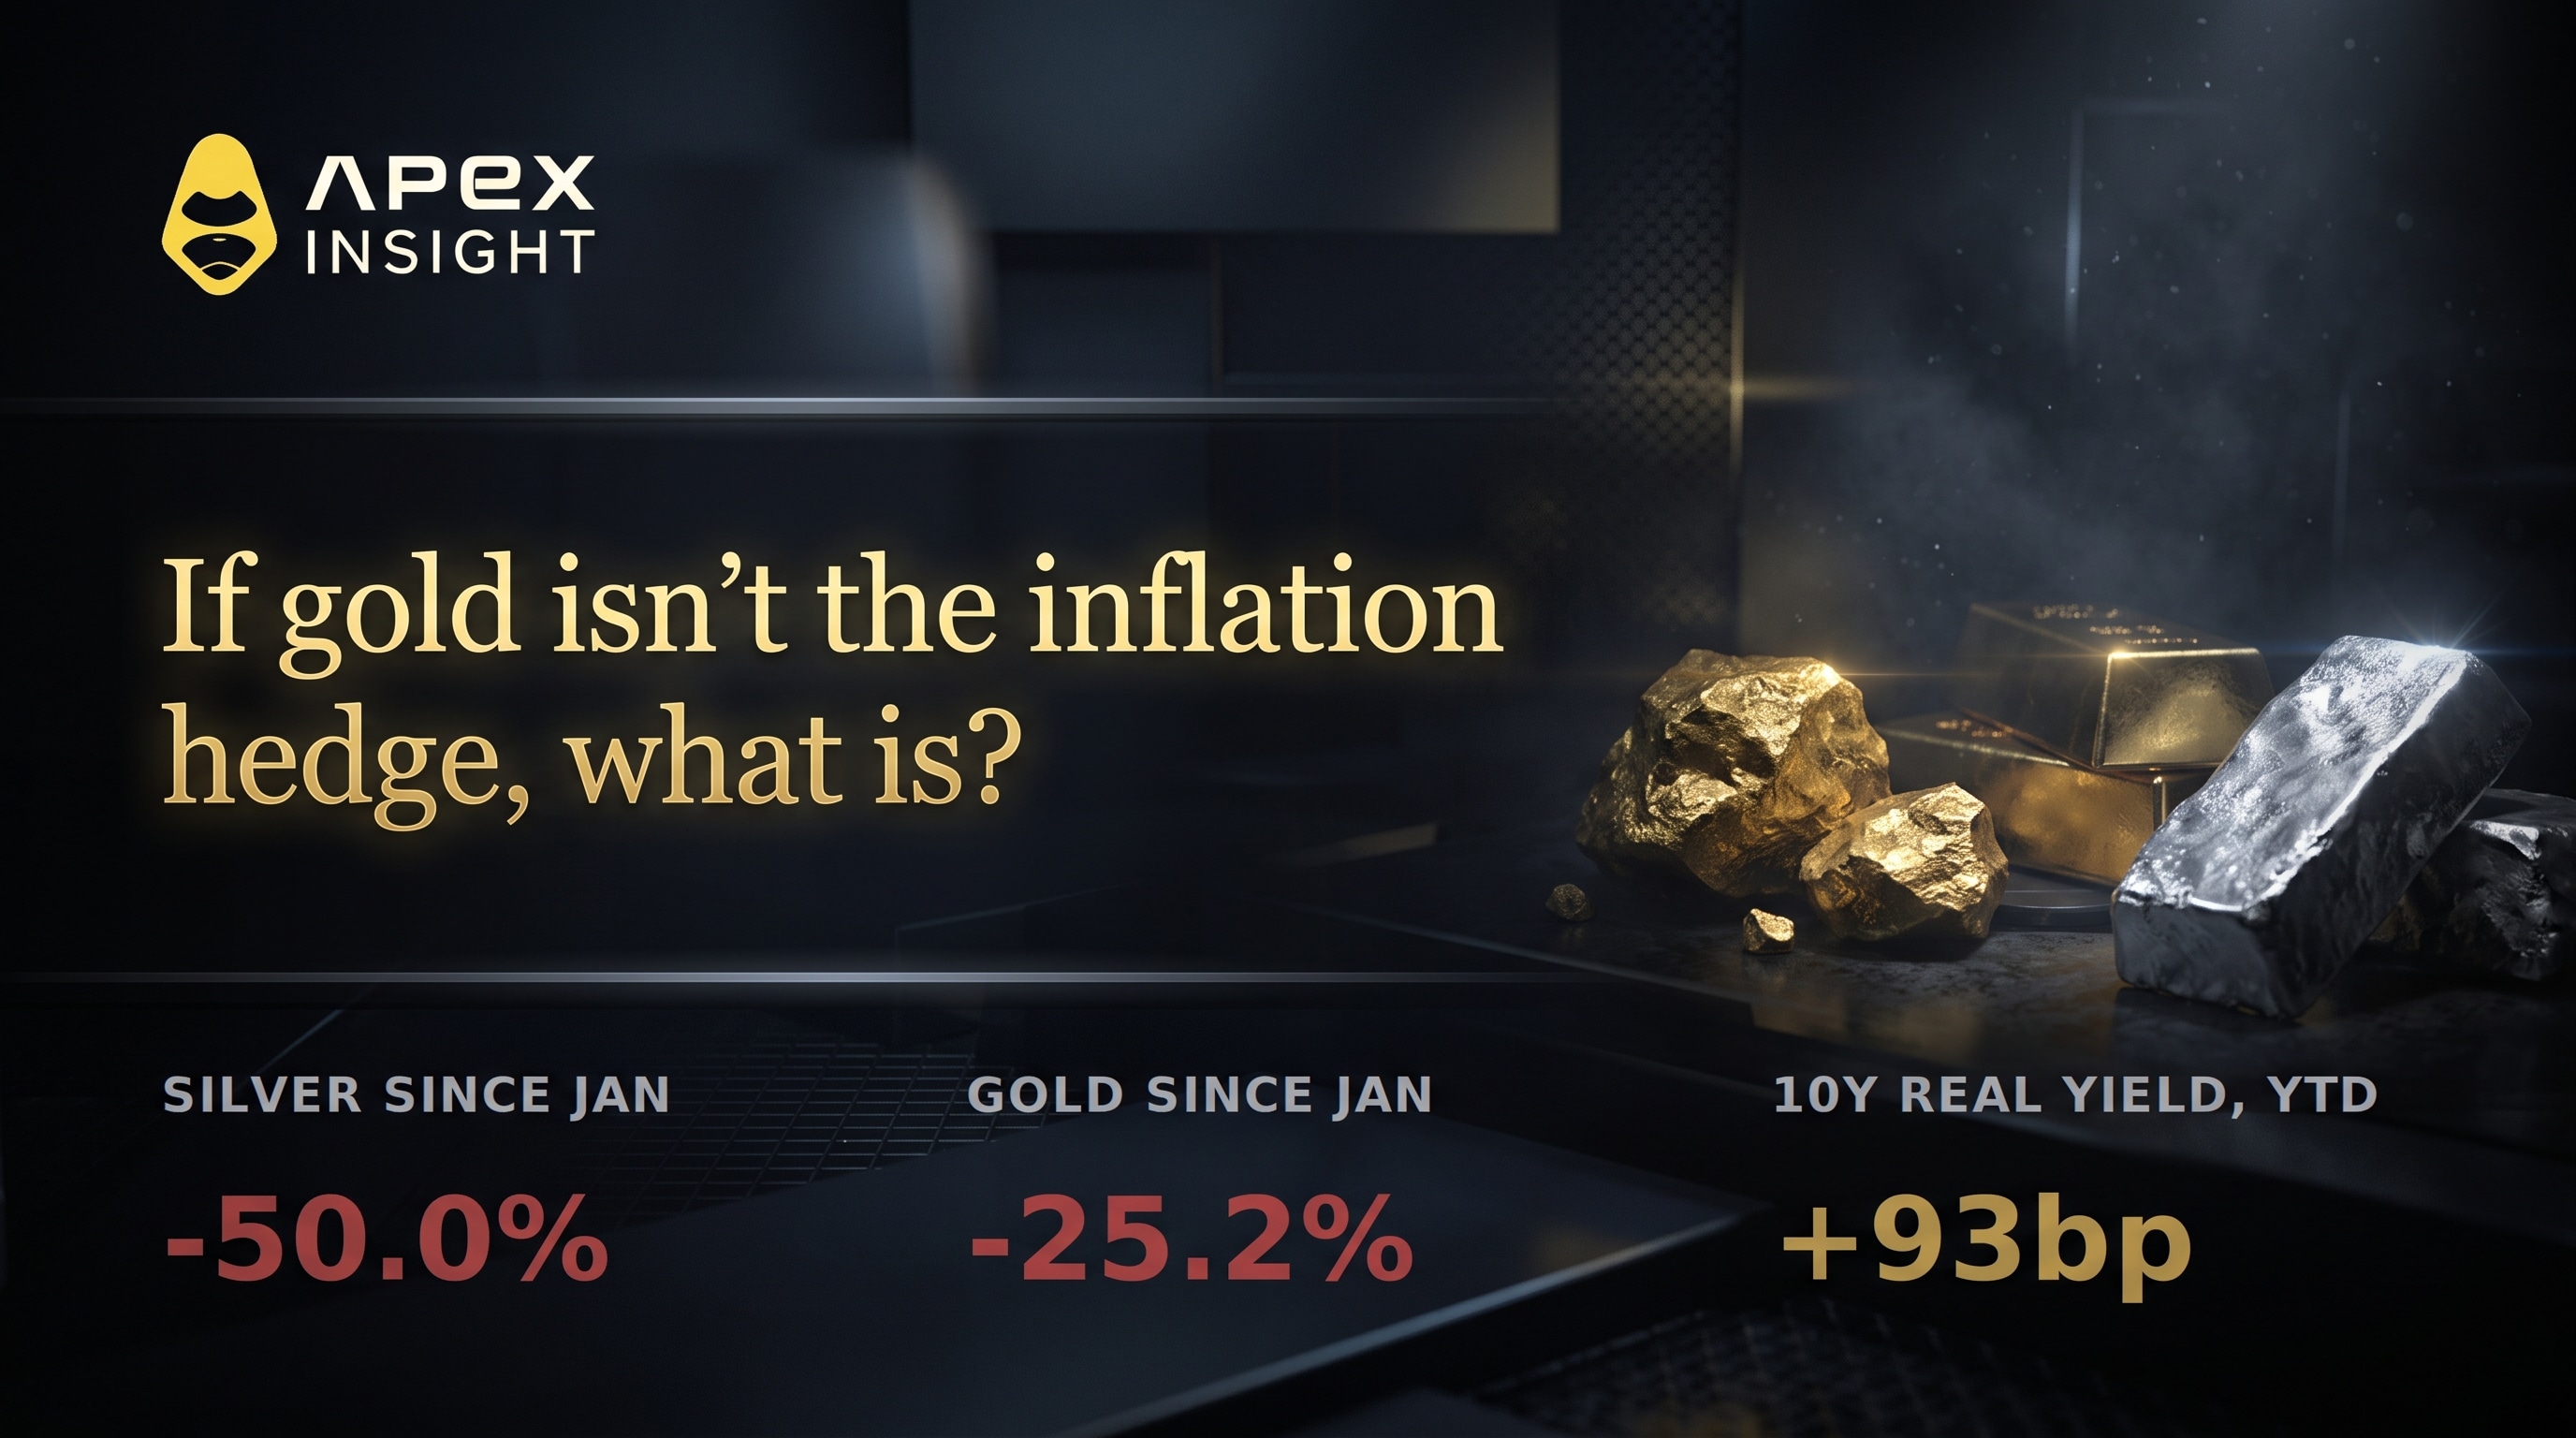
Silver fell 5.45% on the ApeX contract and closed at a new 90-day low — its sixth-worst session out of the last 199, a bottom-3% day. In spot terms the fall was steeper still, around 6% to roughly $55.50, with gold down about 1.5% through $4,100.
On the day the inflation data came in above forecast, the classic inflation hedge had one of its worst sessions of the year, and its single worst hour was the print hour.
Be careful about the mechanism, though. On the day itself the long real yield did not rise — the ten-year closed lower. So Wednesday's move in silver is best read as part of the same liquidation that hit equities, not as a separate real-rate repricing.
The real-rate story is a year, not a session. The ten-year TIPS yield has gone from 1.94% in January to about 2.9%, roughly ninety-four basis points, to levels last seen in 2008. That is the number that explains gold's drawdown from its January record, why a CoreWeave bond clears at 15%, and why the most aggressively financed corner of the equity market is the one coming apart. Wednesday was one session inside that repricing, not the cause of it.
Energy did not move at all. Crude finished up 0.11%, the oil ETF up 0.03%, Brent down 0.54%, natural gas down 1.10% — a bucket median of −0.25% on a day when the median contract fell 3.7%.
That is the quiet joke in the whole episode. Gasoline was more than half of the monthly inflation increase. The asset that produces gasoline did not react to the inflation report at all, because the oil price is observable in real time and the CPI merely confirmed in September data what the crude tape had been saying since July. CPI is a lagging summary of something energy traders already knew.
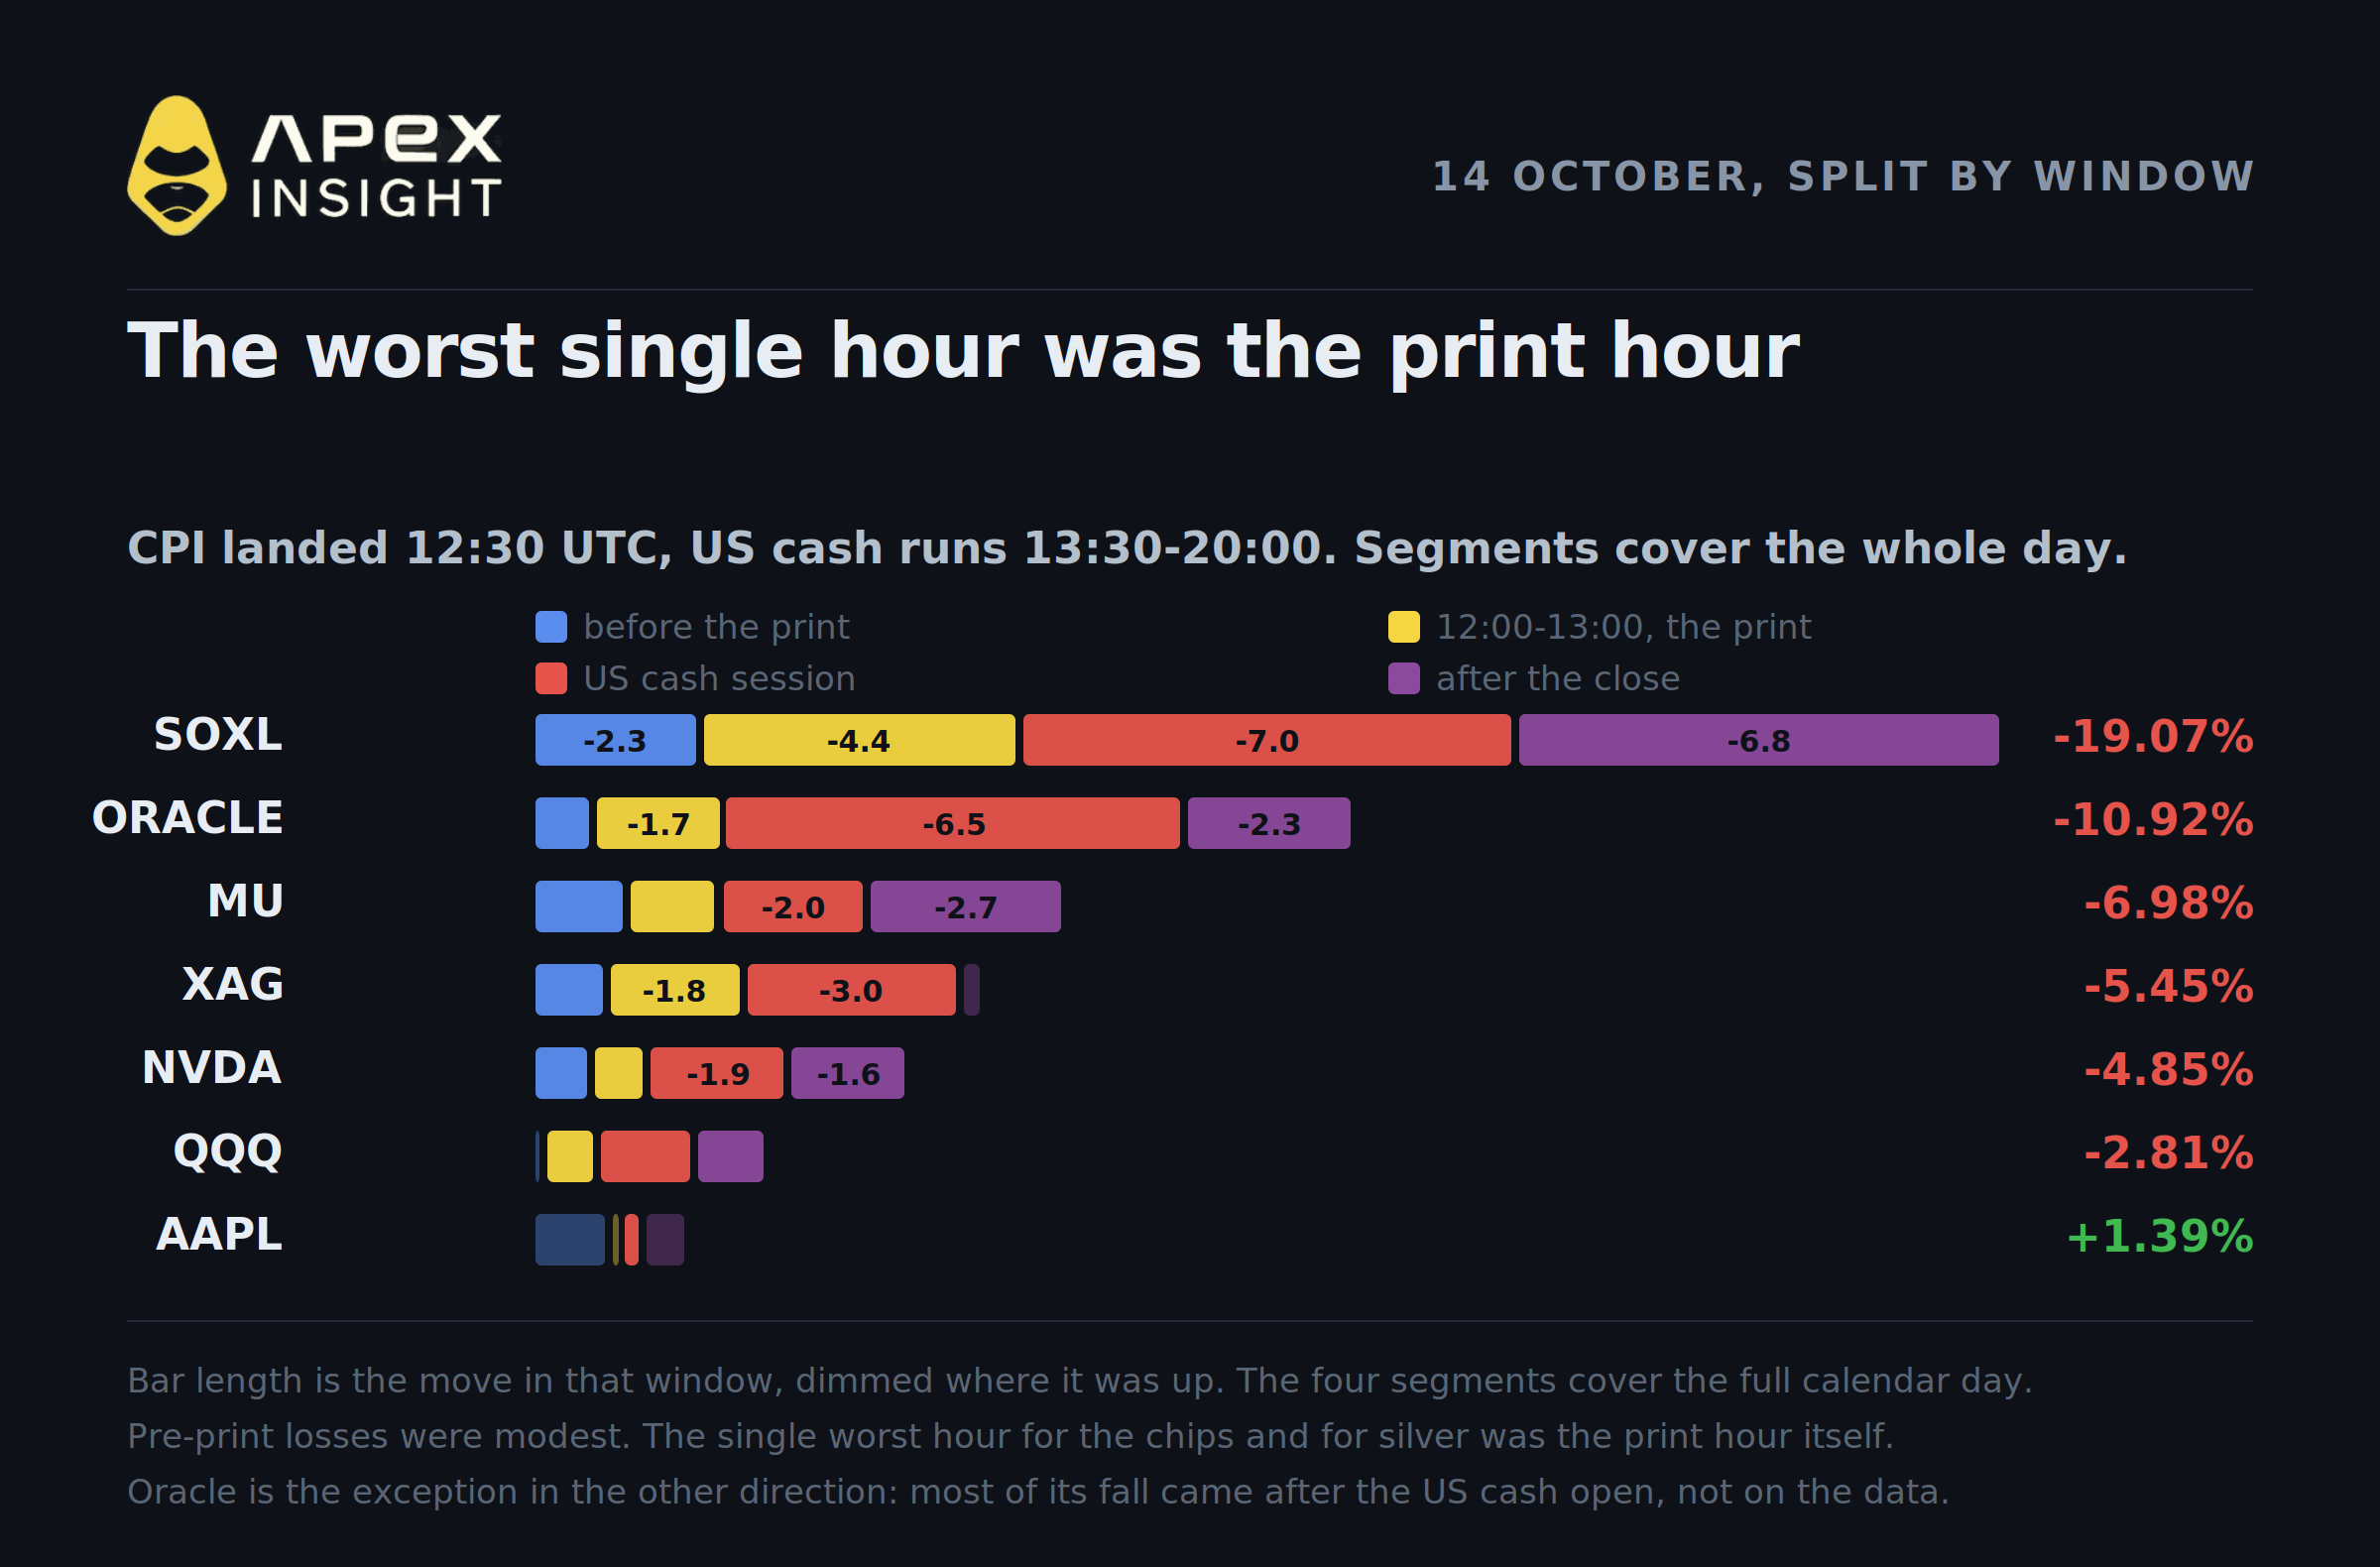
The intraday record is more honest than that, and it cuts the other way. Measured from the prior close, SOXL was down only 2.3% and silver 1.0% before the 12:30 release. Both then took their worst single hour of the day in the print window itself — SOXL 4.4%, silver 1.8%. The longer US cash session did more in total, but no other hour did as much.
So the print was not innocent. It was the largest single accelerant of the day. Oracle is the exception in the other direction: it fell 1.8% on the data and then 6.5% during the US cash session, which is where a credit story would show up, not on the number itself.
A measurement note, if you trade the perps
One thing worth knowing if you hold tokenised equity contracts rather than the underlying shares.
ApeX prints calendar-day bars, from 00:00 to 24:00 UTC. The US cash session runs 13:30 to 20:00 UTC. That means the contract's daily bar includes the overnight Asian and European hours, which the share itself does not trade through — and in this particular week, the overnight session is precisely where the CXMT news landed.
The gap is large and systematic:
Contract | ApeX calendar day | US cash close to close |
|---|---|---|
SOXL | −19.1% | −13.1% |
Micron | −7.0% | −4.1% |
Nvidia | −4.9% | −3.1% |
Oracle | −10.9% | −9.1% |
Apple | +1.4% | +0.6% |
Neither number is wrong. If you held the perp through Wednesday you genuinely lost 19% on SOXL, because you were exposed to a session the ETF holder slept through. But if you are comparing your contract against what you read about the stock market, you are comparing two different windows, and the perp will look more violent every time. Everything in this article measured against the US session uses the 20:00-to-20:00 window; the 24-hour markets — crude, gold, silver, gas, crypto — use the calendar day, because for those the calendar day is the whole market.
What to watch
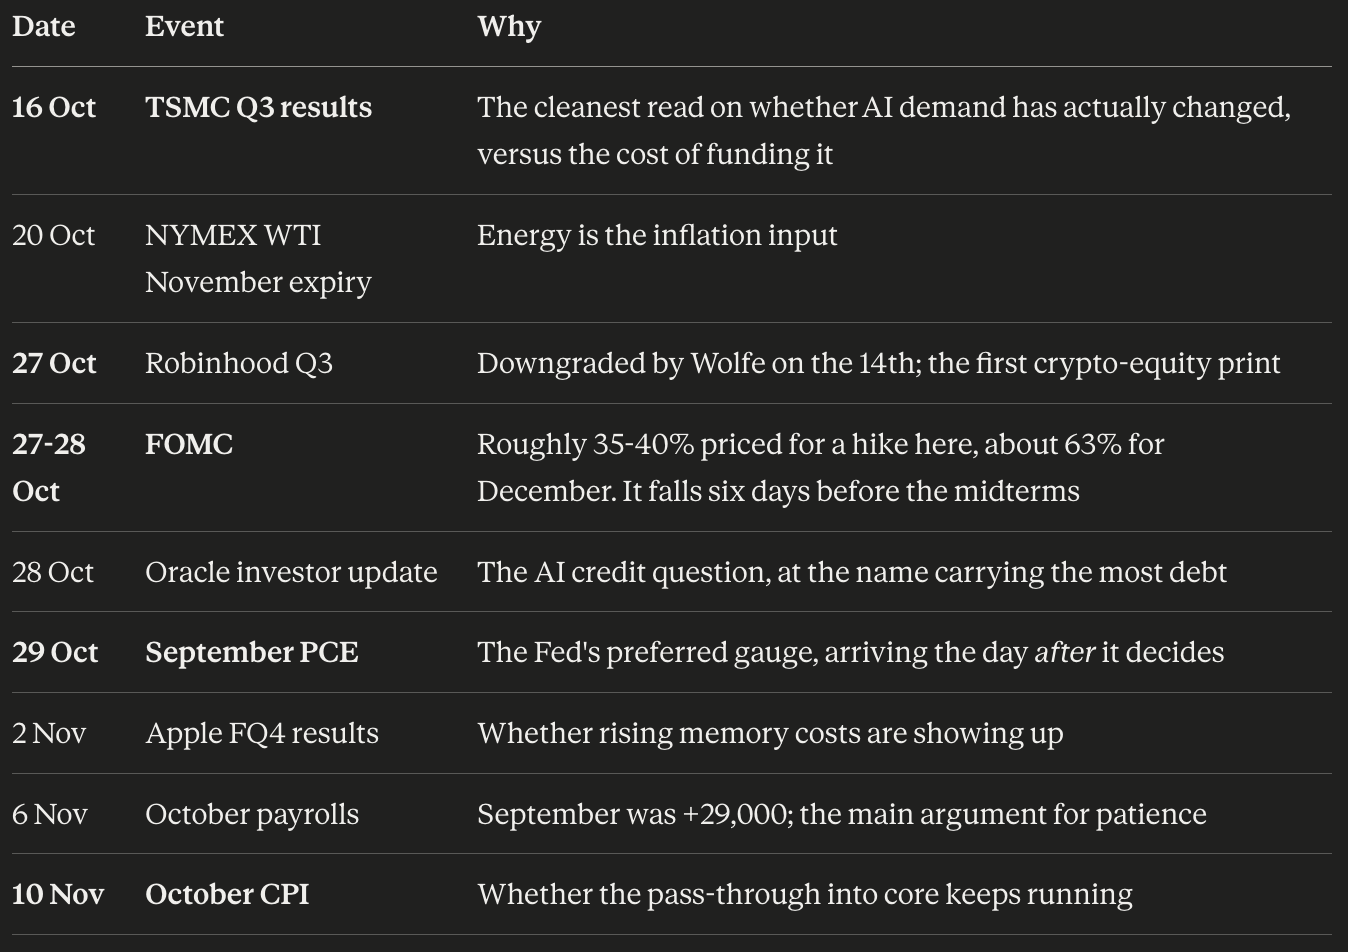
The honest summary is that two things happened in the same week and the louder one got most of the credit.
The inflation print was hot, and hotter underneath than on the surface: the headline was gasoline, which was priced, but the surprise was in core, where the three-month rate has gone from 2.0% to 3.4%. That is the energy shock finishing its journey into the part of the index the Fed is actually responsible for, and it is why the front end sold off and Citi moved to a December hike. It was also the single worst hour of Wednesday for the assets that fell hardest.
But it landed on a market that was already five sessions into a semiconductor decline, for reasons printed in Shanghai on 10 October and in a CoreWeave bond yield on the 14th. Strip the print out and most of that week still happens.
The thread running through both is not the inflation rate. It is the real rate, up about ninety-four basis points this year to its highest since 2008 — the number that explains gold's drawdown, AI paper clearing at 15%, and why the most aggressively financed corner of the market is the one coming apart. The inflation trade was never an energy trade. It is a real-rate trade, and the short leg is whatever got financed on the assumption that capital would stay cheap.
Right now, that is AI infrastructure.
Trade the markets in this article
Every contract named above is live on ApeX Omni against USDT, in one account on one margin balance — the memory chain, the Korean index, gold, crude and bitcoin side by side, which is the only reason this article could measure them against each other at all. The links go straight to the order book.
The memory and semiconductor chain — the part of the market that was already five sessions into a decline before the print landed: SOXLUSDT · MUUSDT · SKHYNIXUSDT · SAMSUNGUSDT · DRAMUSDT · EWYUSDT · NVDAUSDT
The AI-credit leg — the names carrying the financing assumption: ORACLEUSDT · LITEUSDT
The real-rate trade — the metals that have spent the year showing what a 2.87% real yield does: XAUUSDT · XAGUSDT
Energy — more than half of the monthly inflation increase, and it did not move on the day: CLUSDT · NATGASUSDT
The benchmarks you are measuring all of it against: SPYUSDT · QQQUSDT · AAPLUSDT · BTCUSDT · ETHUSDT
Two things to carry in with you. The equity and commodity contracts settle against an index rather than the share or the barrel, and ApeX classifies them in its own contract data as stock contracts rather than perpetuals — worth checking against the terms if you are trading one of these to qualify for a volume promotion written around "perpetual" volume. And they run twenty-four hours while the thing they track does not. That is the measurement note above restated as a risk: the overnight session is where the CXMT headline landed, it is where SOXL did the six percentage points that separate its calendar day from its cash day, and it is where a leveraged position gets marked while the market it references is shut.
Price, volume and return data are from ApeX Omni contract data as of 15 October 2026. Equity contract moves for 14 October are measured US cash close to close, 20:00 to 20:00 UTC, because ApeX prints calendar-day bars while the underlying shares trade only 13:30-20:00; the 24-hour markets use the calendar day. Correlations use daily weekday returns over a 60-session window. CPI figures are from the Bureau of Labor Statistics release of 14 October 2026; rate probabilities are from CME FedWatch; Treasury yields, sector returns, index closes and company figures are from the sources named inline. Figures for the 15 October Asian session are intraday at the time of writing and will have moved. Nothing here is investment advice; tokenised stock perpetuals carry leverage risk and settle against an index rather than the share itself.