




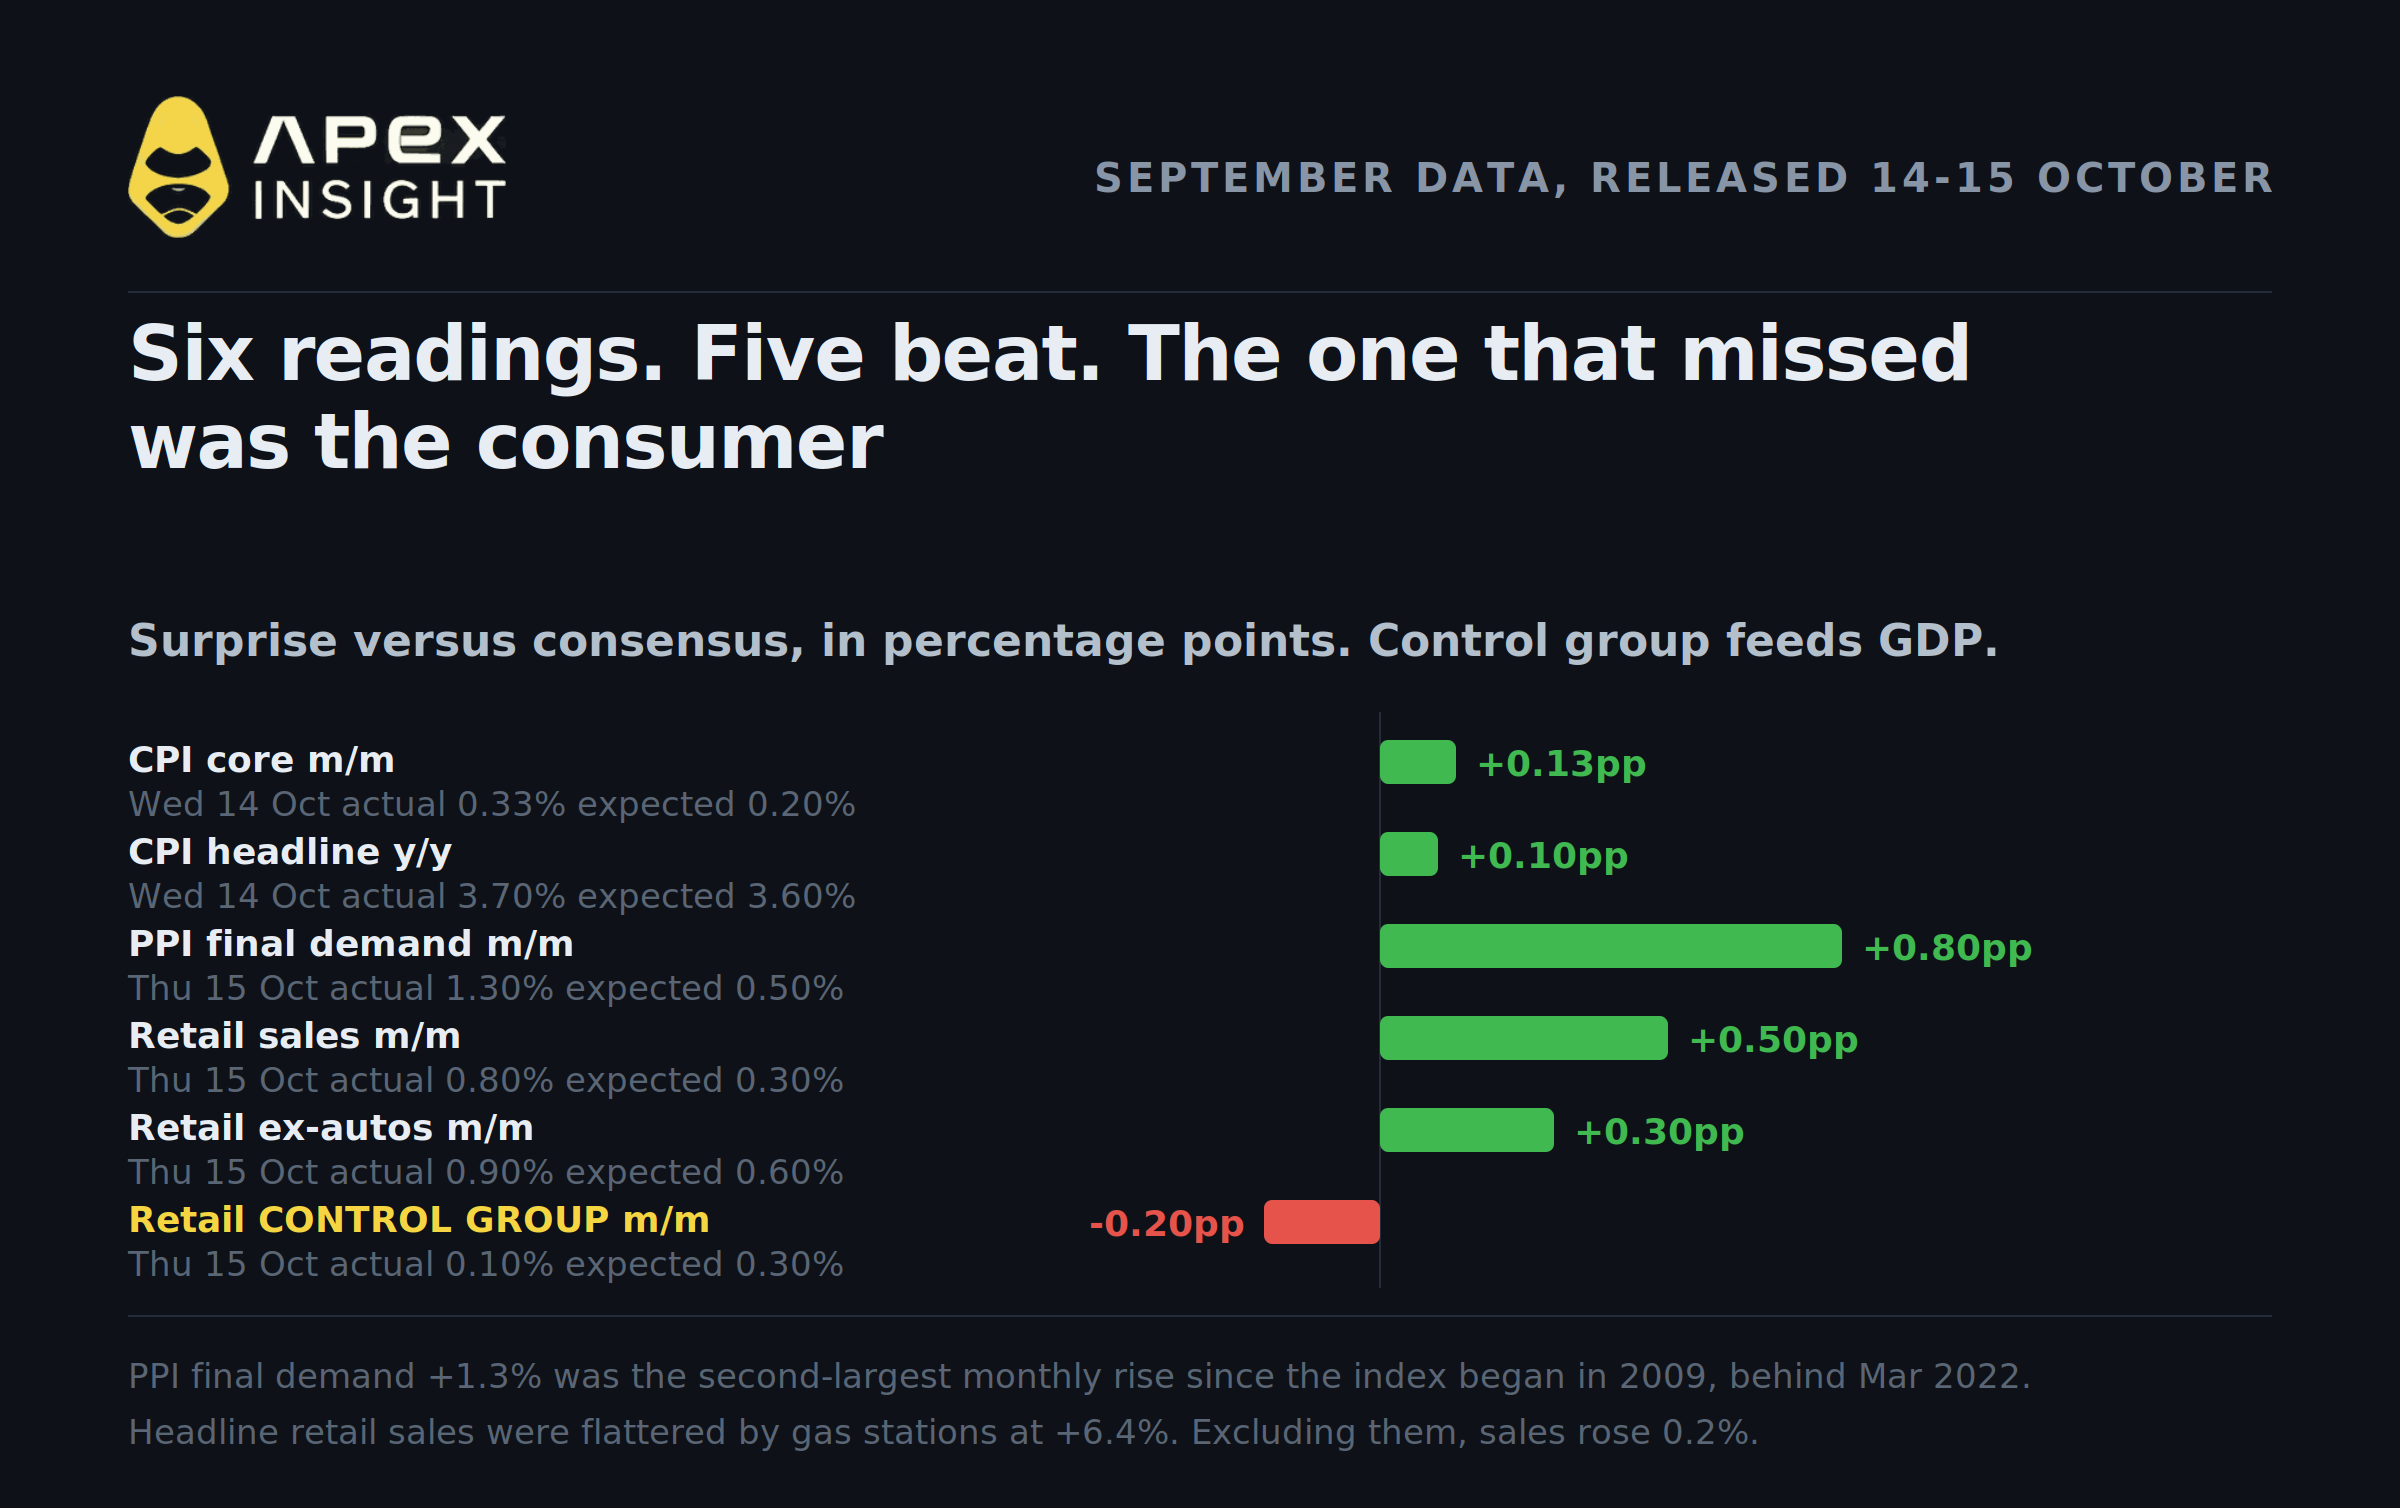
Wholesale inflation in September rose at the second-fastest monthly pace in the history of the series. Retail sales beat by half a point. Consumer prices had come in hot the day before, with the core three-month annualised rate up at 3.4%.
The market's response was to buy almost everything.
Across the 43 ApeX contracts tracked in this article, the median move during the hour containing Thursday's producer price release was 0.32%. The Nasdaq proxy moved +0.01%. Over the following seven hours, 41 of those 43 contracts rose. The ten-year Treasury yield fell about 13 basis points to roughly 5.06%, its sharpest one-day decline in over a year, and the thirty-year fell about 10.
Hot inflation data is supposed to push yields up and risk assets down. This week it did the opposite, and the reaction got weaker as the numbers got hotter.
That gap between what the data said and what the market did is the story, and it is why the six stocks below are about to diverge.
What actually printed
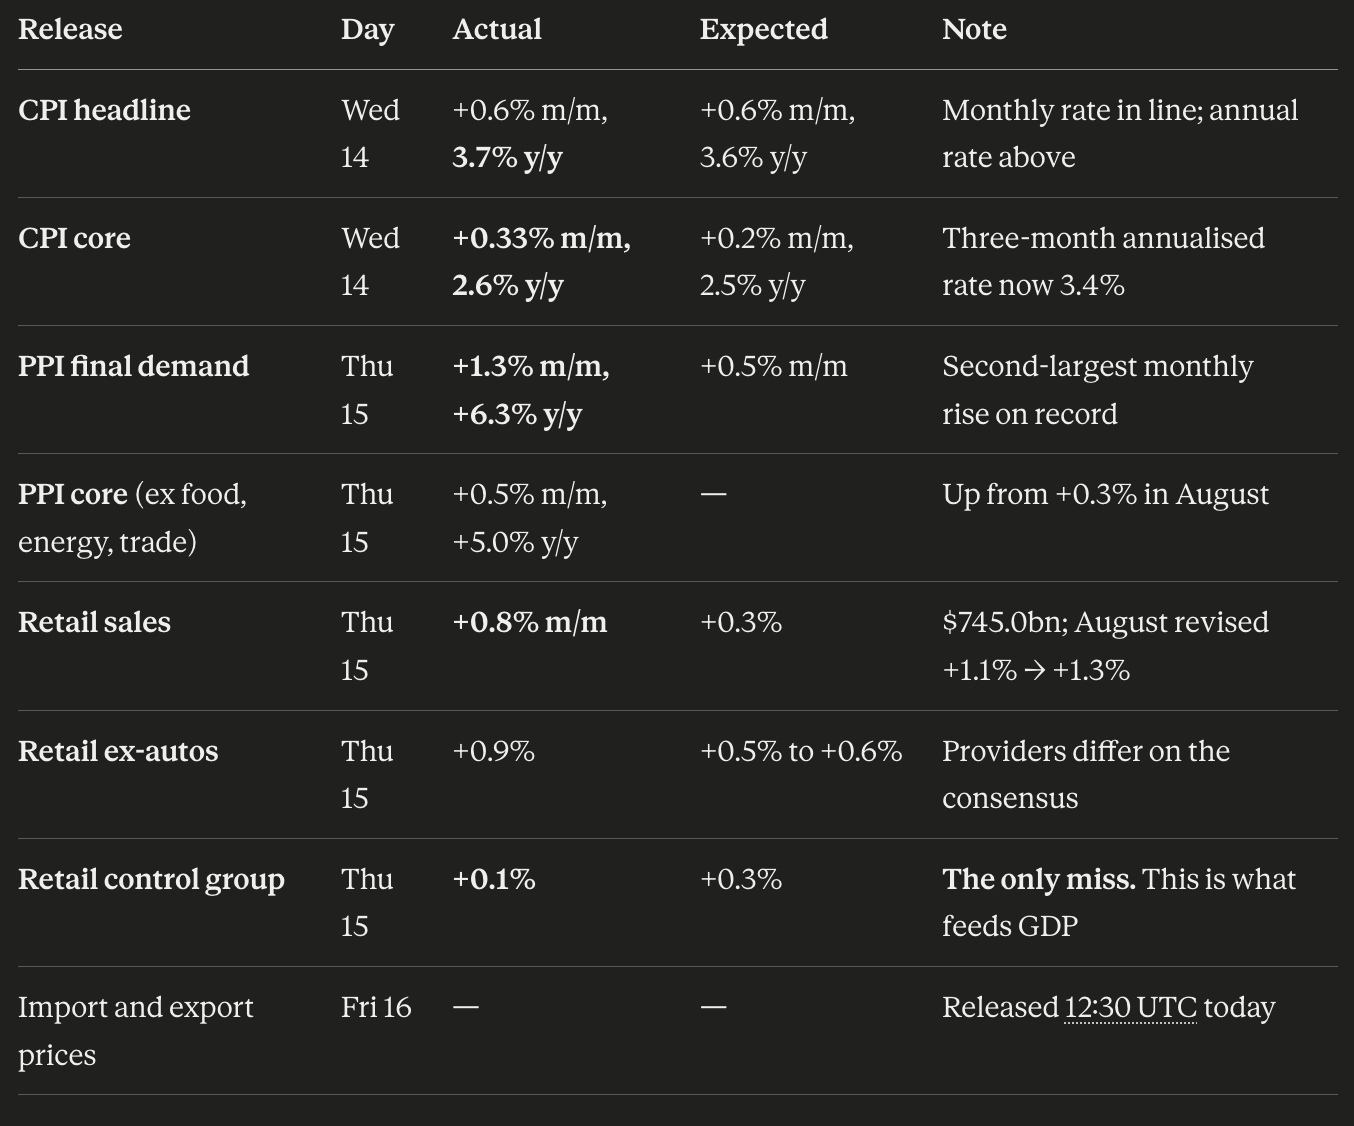
Two numbers explain most of the rest.
About half the producer price jump was one input. Energy rose 10.8% at the producer level and gasoline rose 20.3%, contributing roughly half of the 1.3% headline. Goods overall rose 2.6%, the largest increase since that series began in December 2009, and energy accounts for more than eighty per cent of that goods rise — though not of the headline. Strip energy out and final demand rose 0.7% — still hot, but well short of the headline.
The retail sales beat was the same gallon of gasoline. Gas stations rose 6.4%. Excluding them, retail sales rose 0.2%. The control group — which strips out autos, gasoline, building materials and food services, and is the piece that feeds the GDP calculation — rose 0.1% against a 0.3% forecast, after a 1.2% August.
So the headline said the consumer is spending more. The control group said the consumer is buying the same things and paying more for fuel. Those are different economies, and only one of them is an argument for a rate hike.
The honest caveat is that this is not purely an energy story. Core PPI at +0.5% on the month and +5.0% on the year has nothing to do with gasoline. Services rose 0.8%, the most since April; trade margins rose 1.4% and transportation and warehousing 3.4%. There is a real underlying price impulse here. It is simply much smaller than the headline, and the headline is what hit screens at 12:30 UTC.
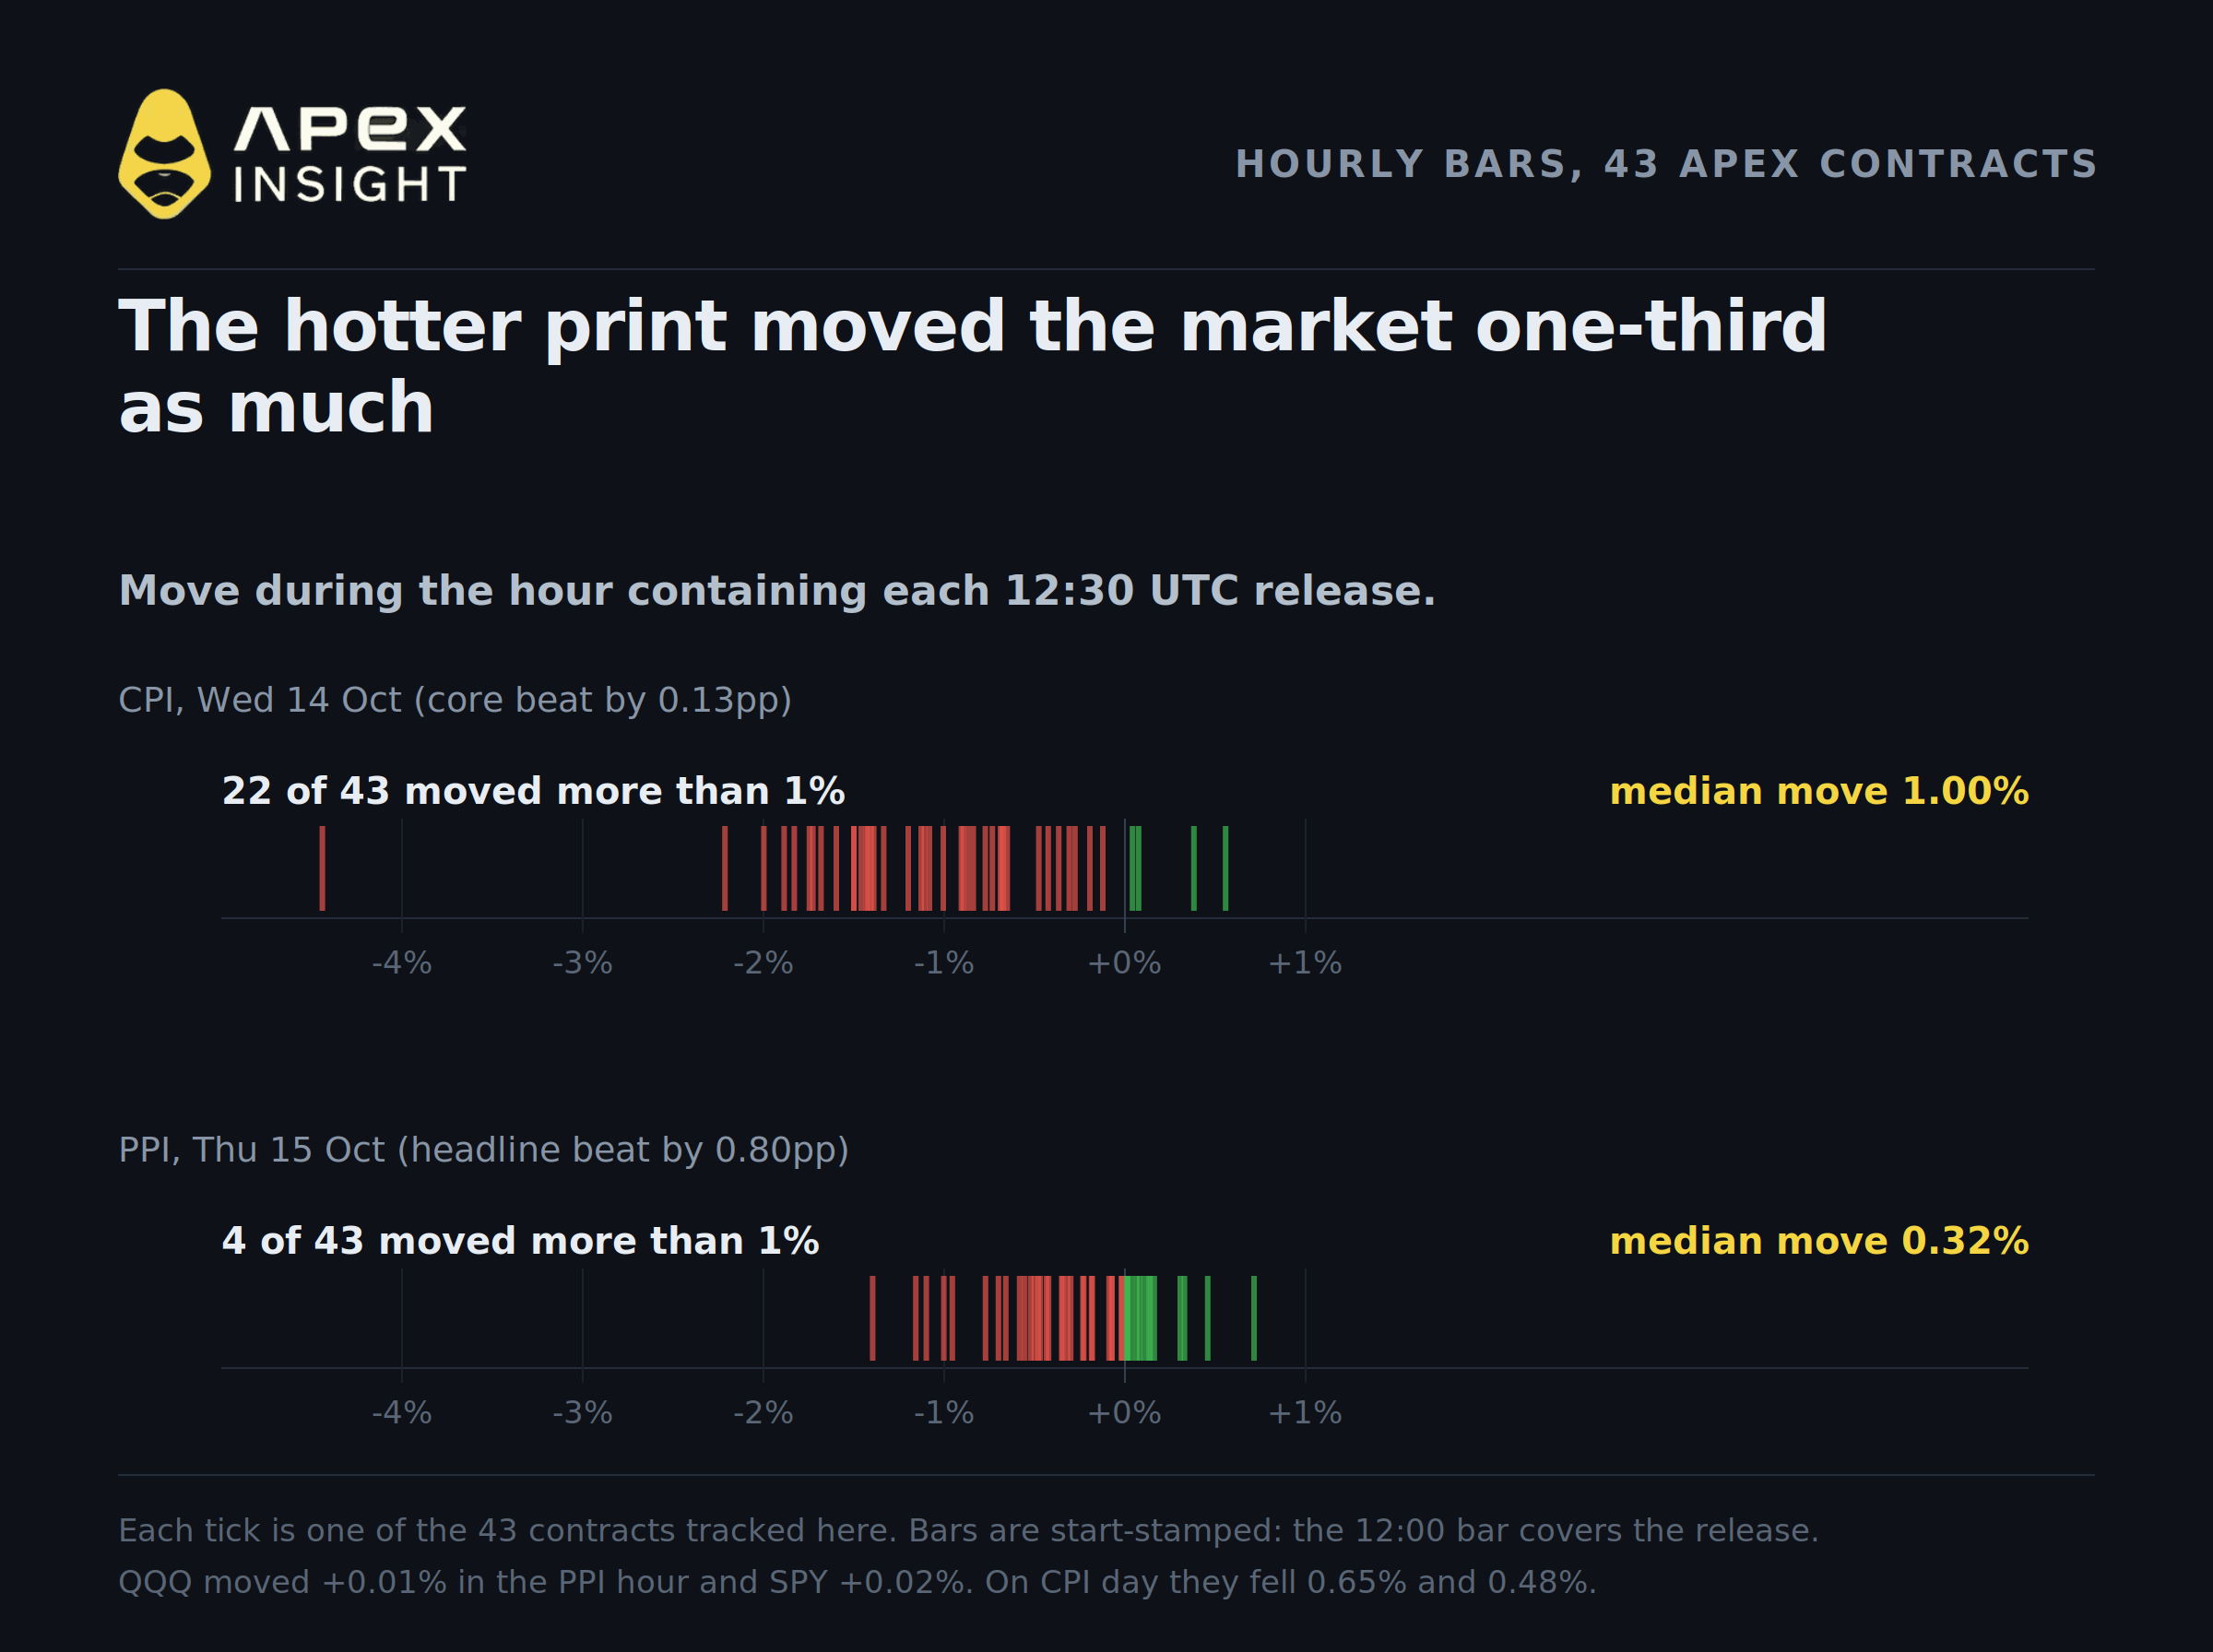
The reaction shrank as the data got hotter
This is the part worth sitting with before positioning for the next print.
On Wednesday, core CPI beat consensus by roughly a tenth of a point. In the hour containing that release, 22 of 43 contracts moved more than 1%, and the median absolute move was 1.00%. The 3x semiconductor ETF fell 4.44% in sixty minutes.
On Thursday, the PPI headline beat by 0.80 percentage points — a far bigger surprise — and four of 43 contracts moved more than 1%. The median absolute move was 0.32%. The Nasdaq proxy moved +0.01% and the S&P proxy +0.02%.
A much larger surprise produced roughly one-third the reaction. There are two readings of that, with opposite implications.
The first is that the market has learned to look through energy-driven headlines. It parsed the composition within minutes, saw gasoline, saw the control group miss, and concluded that this does not change the policy path much. Whether that read is right is not knowable until the Fed meets.
The second, less comfortable reading is exhaustion. By Thursday the semiconductor complex was already eight sessions into a decline, and the six largest memory and storage names had shed roughly $1.09 trillion in market value since the 2 October close. Markets that have already repriced do not have much left to give on the next headline. A muted reaction can mean the news is understood, or it can mean the sellers are simply done.
There is a third caveat, and it is the one that constrains this finding most. These 43 contracts are not 43 independent observations. Roughly a dozen of them are the same semiconductor and memory trade expressed different ways — a 3x ETF, Nvidia, AMD, Broadcom, Micron, SanDisk, a DRAM index, SK Hynix, Samsung, a Korea ETF — and another seven are crypto beta. So "22 of 43 moved more than 1%" on Wednesday is partly one correlated block counted a dozen times, and Thursday's calm is partly that same block pausing. It was also the week that block absorbed a shock of its own, unrelated to inflation, which the next section covers.
The measurement is accurate. What it supports is narrower than it first appears: on this basket, in this week, the market reacted less to a bigger surprise. What is certain is that the next print lands on a market that has now ignored three in a row.
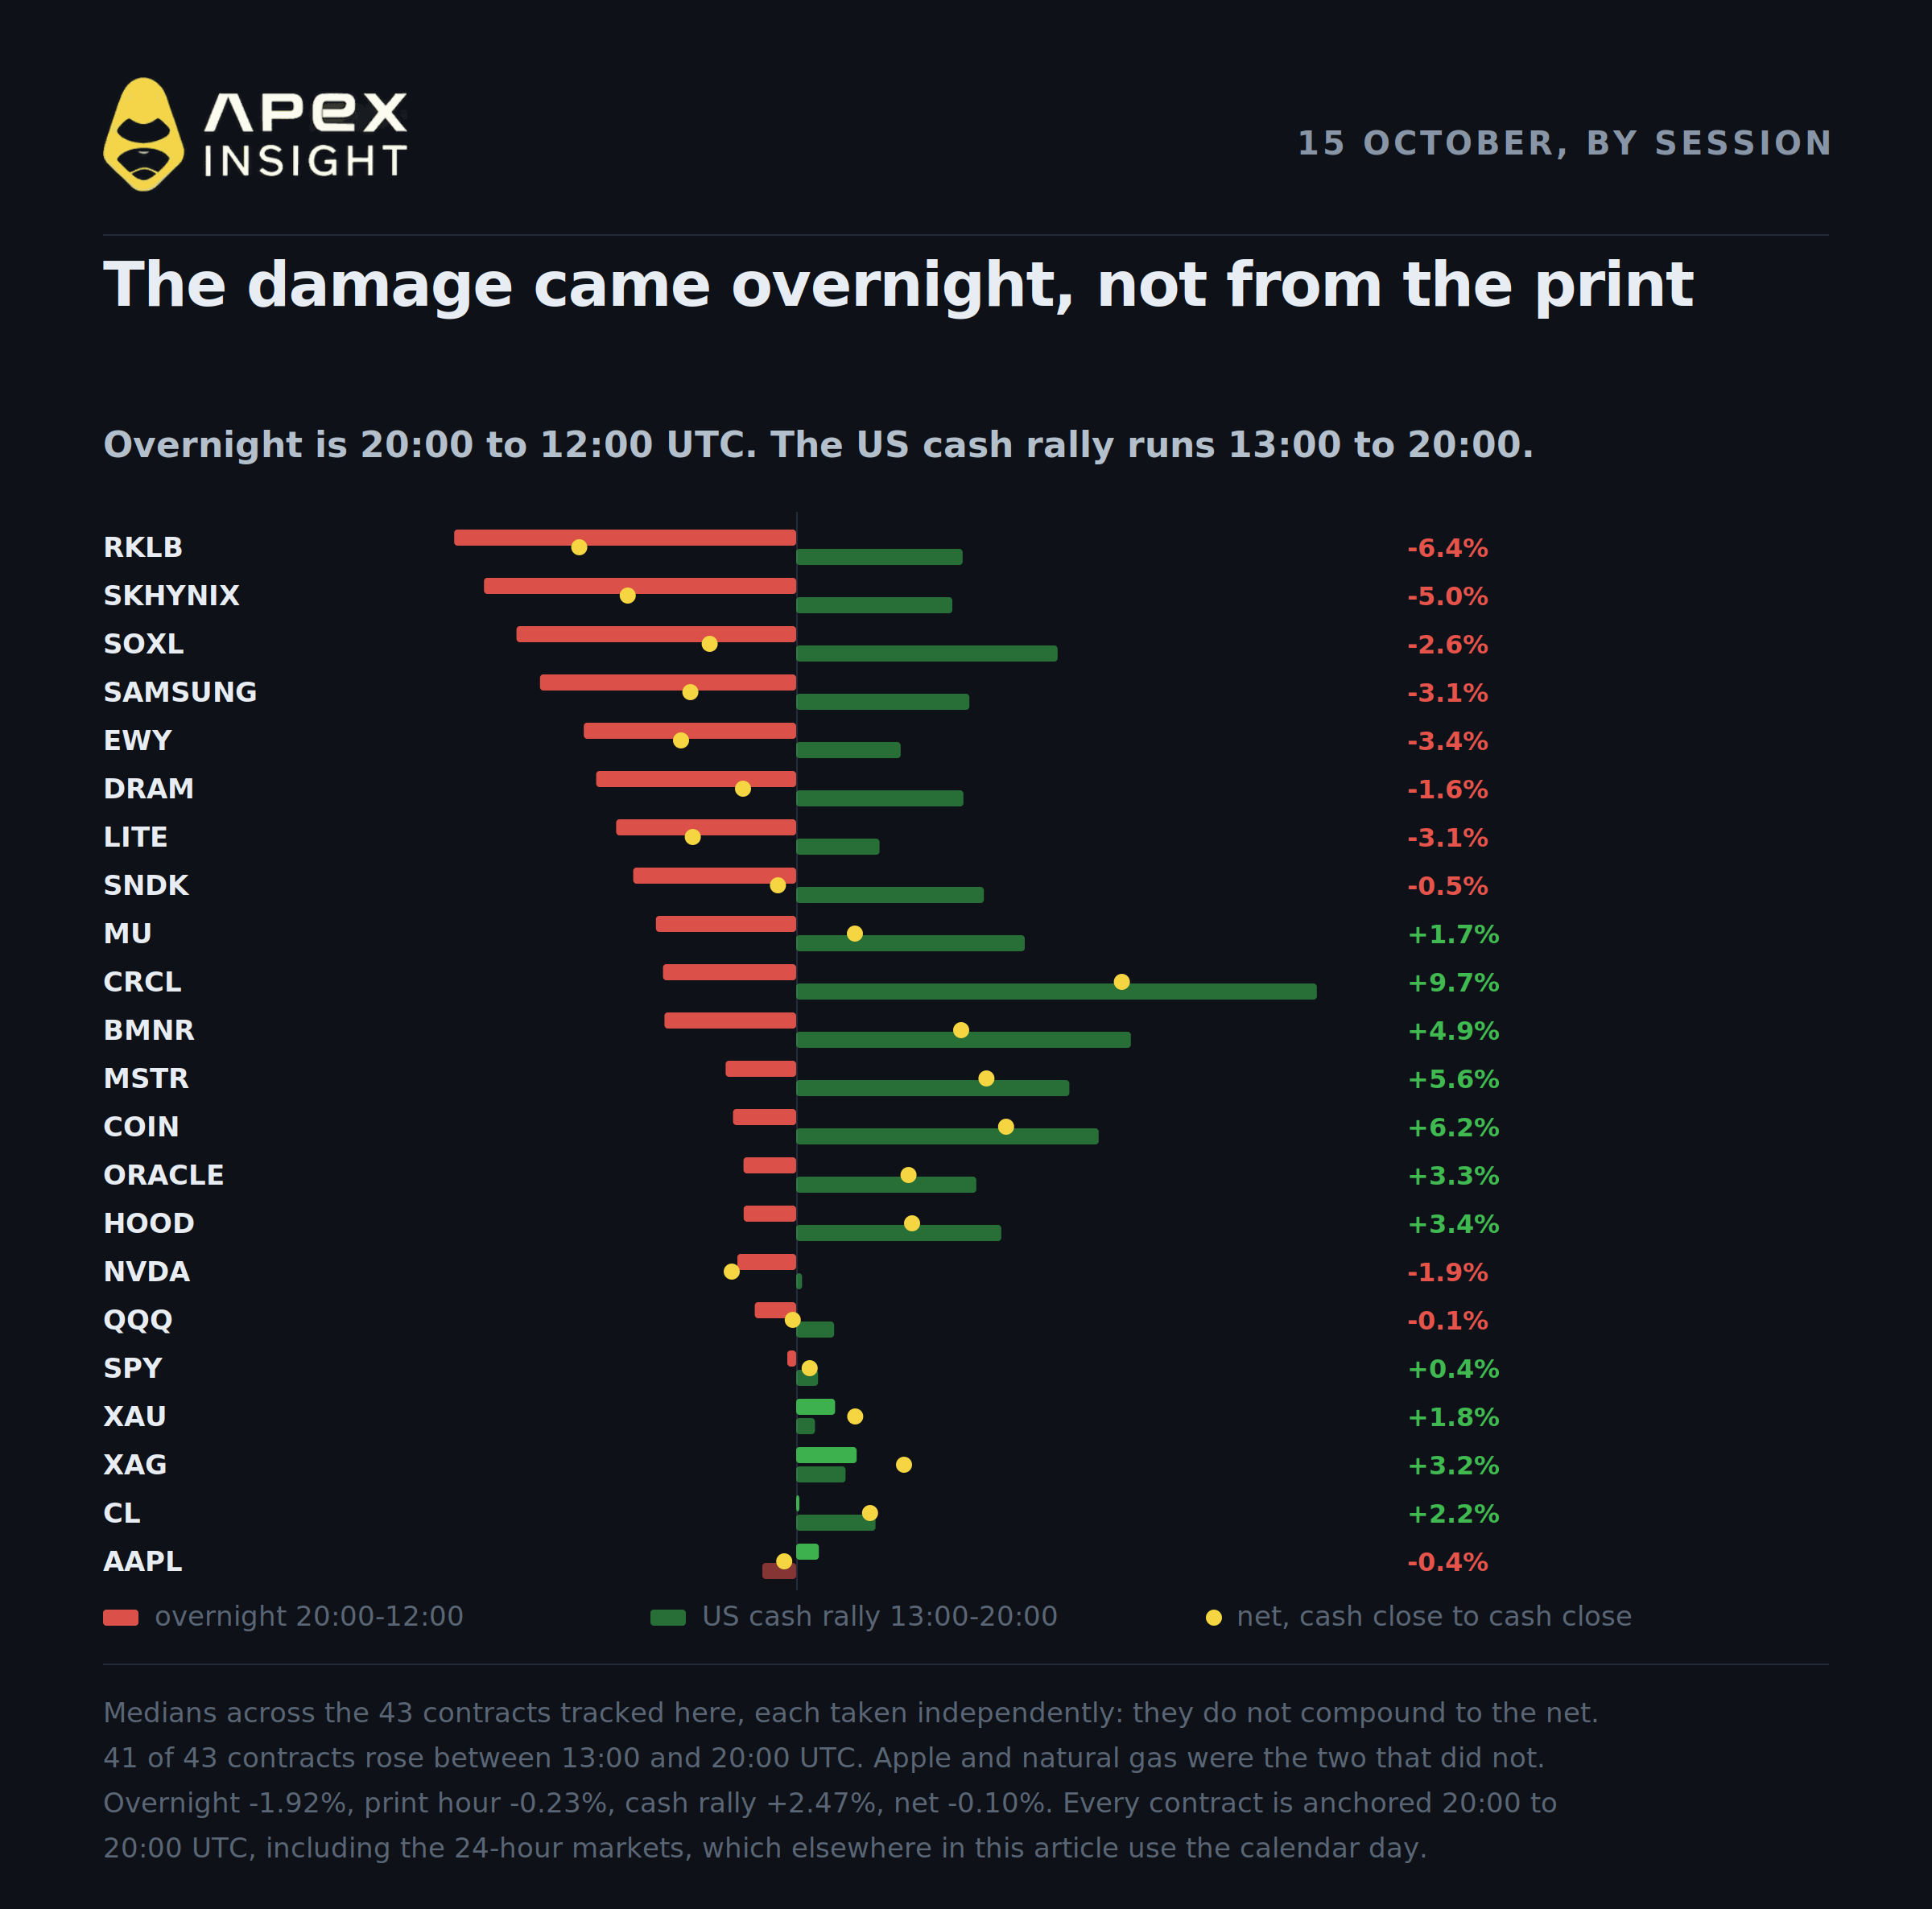
Where the damage actually happened
Thursday decomposes cleanly, and the print is not the interesting part.
Overnight, 20:00 to 12:00 UTC: median −1.92%. Rocket Lab −10.1%, SK Hynix −9.3%, the semiconductor ETF −8.3%, Samsung −7.6%, the Korea ETF −6.3%.
The print hour, 12:00 to 13:00 UTC: median −0.23%.
The US cash session, 13:00 to 20:00 UTC: median +2.47%, with 41 of 43 contracts rising.
Net, cash close to cash close: median −0.10%.
(Each of those is a median taken independently across the 43 contracts, so they describe four separate distributions and do not multiply out to the net.)
The move happened while the US market was shut. In Seoul the Kospi closed down 7.57% with circuit breakers triggered on both the Kospi and the Kosdaq; the Nikkei fell 4.90%, its third-largest point decline on record. Then the US session took almost all of it back. The inflation data arrived in the middle and did essentially nothing.
This matters practically if you hold tokenised equity contracts rather than shares. The ApeX contract trades through that overnight window; the underlying share does not. The semiconductor ETF's calendar-day bar shows +1.6% on Thursday. Its US cash session shows −2.6%. Neither is wrong — they are different windows — but a leveraged position is marked through a window the share never trades in, and this week that window held all the volatility.
What it did to the hike
The Federal Reserve raised its target range to 3.75–4.00% on 16 September, a 25 basis point increase on a 12-0 vote. Chair Kevin Warsh's next meeting is 27–28 October.
The path this week was not a straight line:
Before CPI, 13 October: an October hike was priced around 22% on CME FedWatch — roughly one in five.
CPI morning, 14 October: pricing spiked to about 50% within an hour of the release.
CPI afternoon: it faded hard as Fed officials spoke, down through 41.5% at midday to the low thirties by the close.
After the far hotter PPI, 15 October: it fell again. Reuters had it below 30% through Thursday morning, and end-of-day readings cluster around 27-28%.
This morning: still somewhere in the mid-to-high twenties on futures and the prediction markets, though the spread between venues is wide enough that any single quote should be treated as a snapshot rather than a level.
Note the sequence carefully, because it is easy to get wrong. The largest part of the fade came on CPI afternoon, on Fed-speak, not on the PPI. But the direction on PPI day is still the remarkable bit: the hottest wholesale print in four years landed and October pricing fell by about six points.
December absorbed it. Kalshi and Polymarket had a December hike in the high seventies to low eighties, and CME-derived readings for at least one more move by December have been quoted higher still. The constructs differ — some price a hike at the December meeting, others by it — so the levels are not directly comparable and are best read as a direction rather than a number. That direction is not in dispute: October out, December in.
Three things did that work.
Fed officials talked it down — on CPI day, before the PPI even landed. Vice Chair for Supervision Michelle Bowman, speaking in Bangkok on the 14th, said "I don't feel any urgency for taking further action at this point" and that "we really need to take some time and understand how things will evolve." San Francisco Fed President Mary Daly, in a Reuters interview the same day, indicated she saw no need to act at the October meeting while describing further adjustments as more likely than not. Chair Kevin Warsh added to it after the fact rather than during it: speaking with the IMF's Kristalina Georgieva in Bangkok overnight — late Thursday US time, after the PPI and after October had already been largely priced out — he said "I don't prejudge meetings" and declined to signal anything for the rest of the year.
It is not unanimous. Boston Fed President Susan Collins said on the 13th that she "currently expect[s] that it will be appropriate to raise rates a bit further before the end of the year," qualifying it on how incoming data shapes her outlook. The committee is arguing about timing, not direction.
The composition undercut the headline. A central bank cannot hike away a gasoline price. The part of the index the Fed is responsible for is hot, but it is hot at 0.5% a month, not 1.3%.
The calendar is in the way. The 28 October decision falls six days before the 3 November midterms. In the seven days before an election, the Fed has raised rates once since 1990 — on 2 November 2022. UBS's Simon Penn put the politics bluntly in late September, calling a hike on the eve of the midterms "politically untenable." That is not a prohibition, and the Fed would reject the framing — but it is a real constraint on a committee that guards the appearance of independence, and the market is pricing it.
Bonds went further than an October repricing would justify. A ten basis point drop in the ten-year on a 6.3% annual producer price print is not an inflation response at all.
Two explanations are doing the work, and they reinforce each other.
The first is inside the data. Bloomberg Intelligence's Ira Jersey tied the long-end rally to the weak retail control group combined with the fact that producer prices are now running well ahead of consumer prices. His point was that when producer prices rise faster than consumer prices, margins should theoretically be compressing — producers absorbing costs they cannot pass on. Read that way, a hot PPI is not an inflation signal the Fed must chase so much as a growth-and-earnings warning, and the bond market appears to have treated it as one.
The second is the AI cycle. Goldman Sachs' Bobby Molavi argued in a note reported this week that two of three warning signals for the AI capex cycle have already fired — equity prices diverging from earnings, and credit markets repricing AI financing risk — with only an actual slowdown in capex growth still outstanding. Goldman expects hyperscaler capex growth to peak near +116% year-on-year in the third quarter of 2026 and fall to just over 20% by end-2027. TD Securities' Prashant Newnaha put the mechanism plainly: "the slump in AI is repricing growth expectations down," which makes bonds a hedge for equities again. He also called the bond rally after a hot CPI "highly counter-intuitive," which it is.
The credit signal Molavi points to is not abstract. CoreWeave's 2032 notes were yielding above 15% on Thursday and its five-year credit default swaps reached roughly 1,000 basis points — a level that implies somewhere around a 60% chance of default within five years on standard recovery assumptions. The equity fell 16% on Wednesday, then on Thursday swung from down as much as 9.5% to a close up 5.9% after Nvidia's Jensen Huang said CoreWeave's financial health is improving and that Nvidia need not backstop it. That is what a market repricing financing risk in real time looks like, and it is happening to the most levered borrowers first.
If that is what bonds are discounting, the week makes sense: the long end led, the equal-weight S&P and the Russell 2000 both rose about 1.4% while the technology sector fell 0.65%, and energy was the only sector down more than 1% on a day front-month WTI rose 2.6%. That is a rotation out of financed growth into everything else. It is not an inflation trade.
The counterweight deserves equal billing. TSMC reported on Thursday and beat on every line — record quarterly revenue of $46.7bn, net income up 68.7%, and fourth-quarter guidance above consensus. It reiterated 2026 capital expenditure of $60–64bn and raised its revenue growth target to about 44%. CEO C.C. Wei said demand is "extremely robust" and that the company "did not see any sign of slowdown," adding that demand "is still far above our capability today to supply."
The ADRs fell 1.8% anyway, and the Taiwan index dropped 3.4%.
When the single best-informed company in the supply chain says demand is accelerating and the stock falls regardless, the market is no longer arguing about demand. It is arguing about who pays for the build, and at what rate.
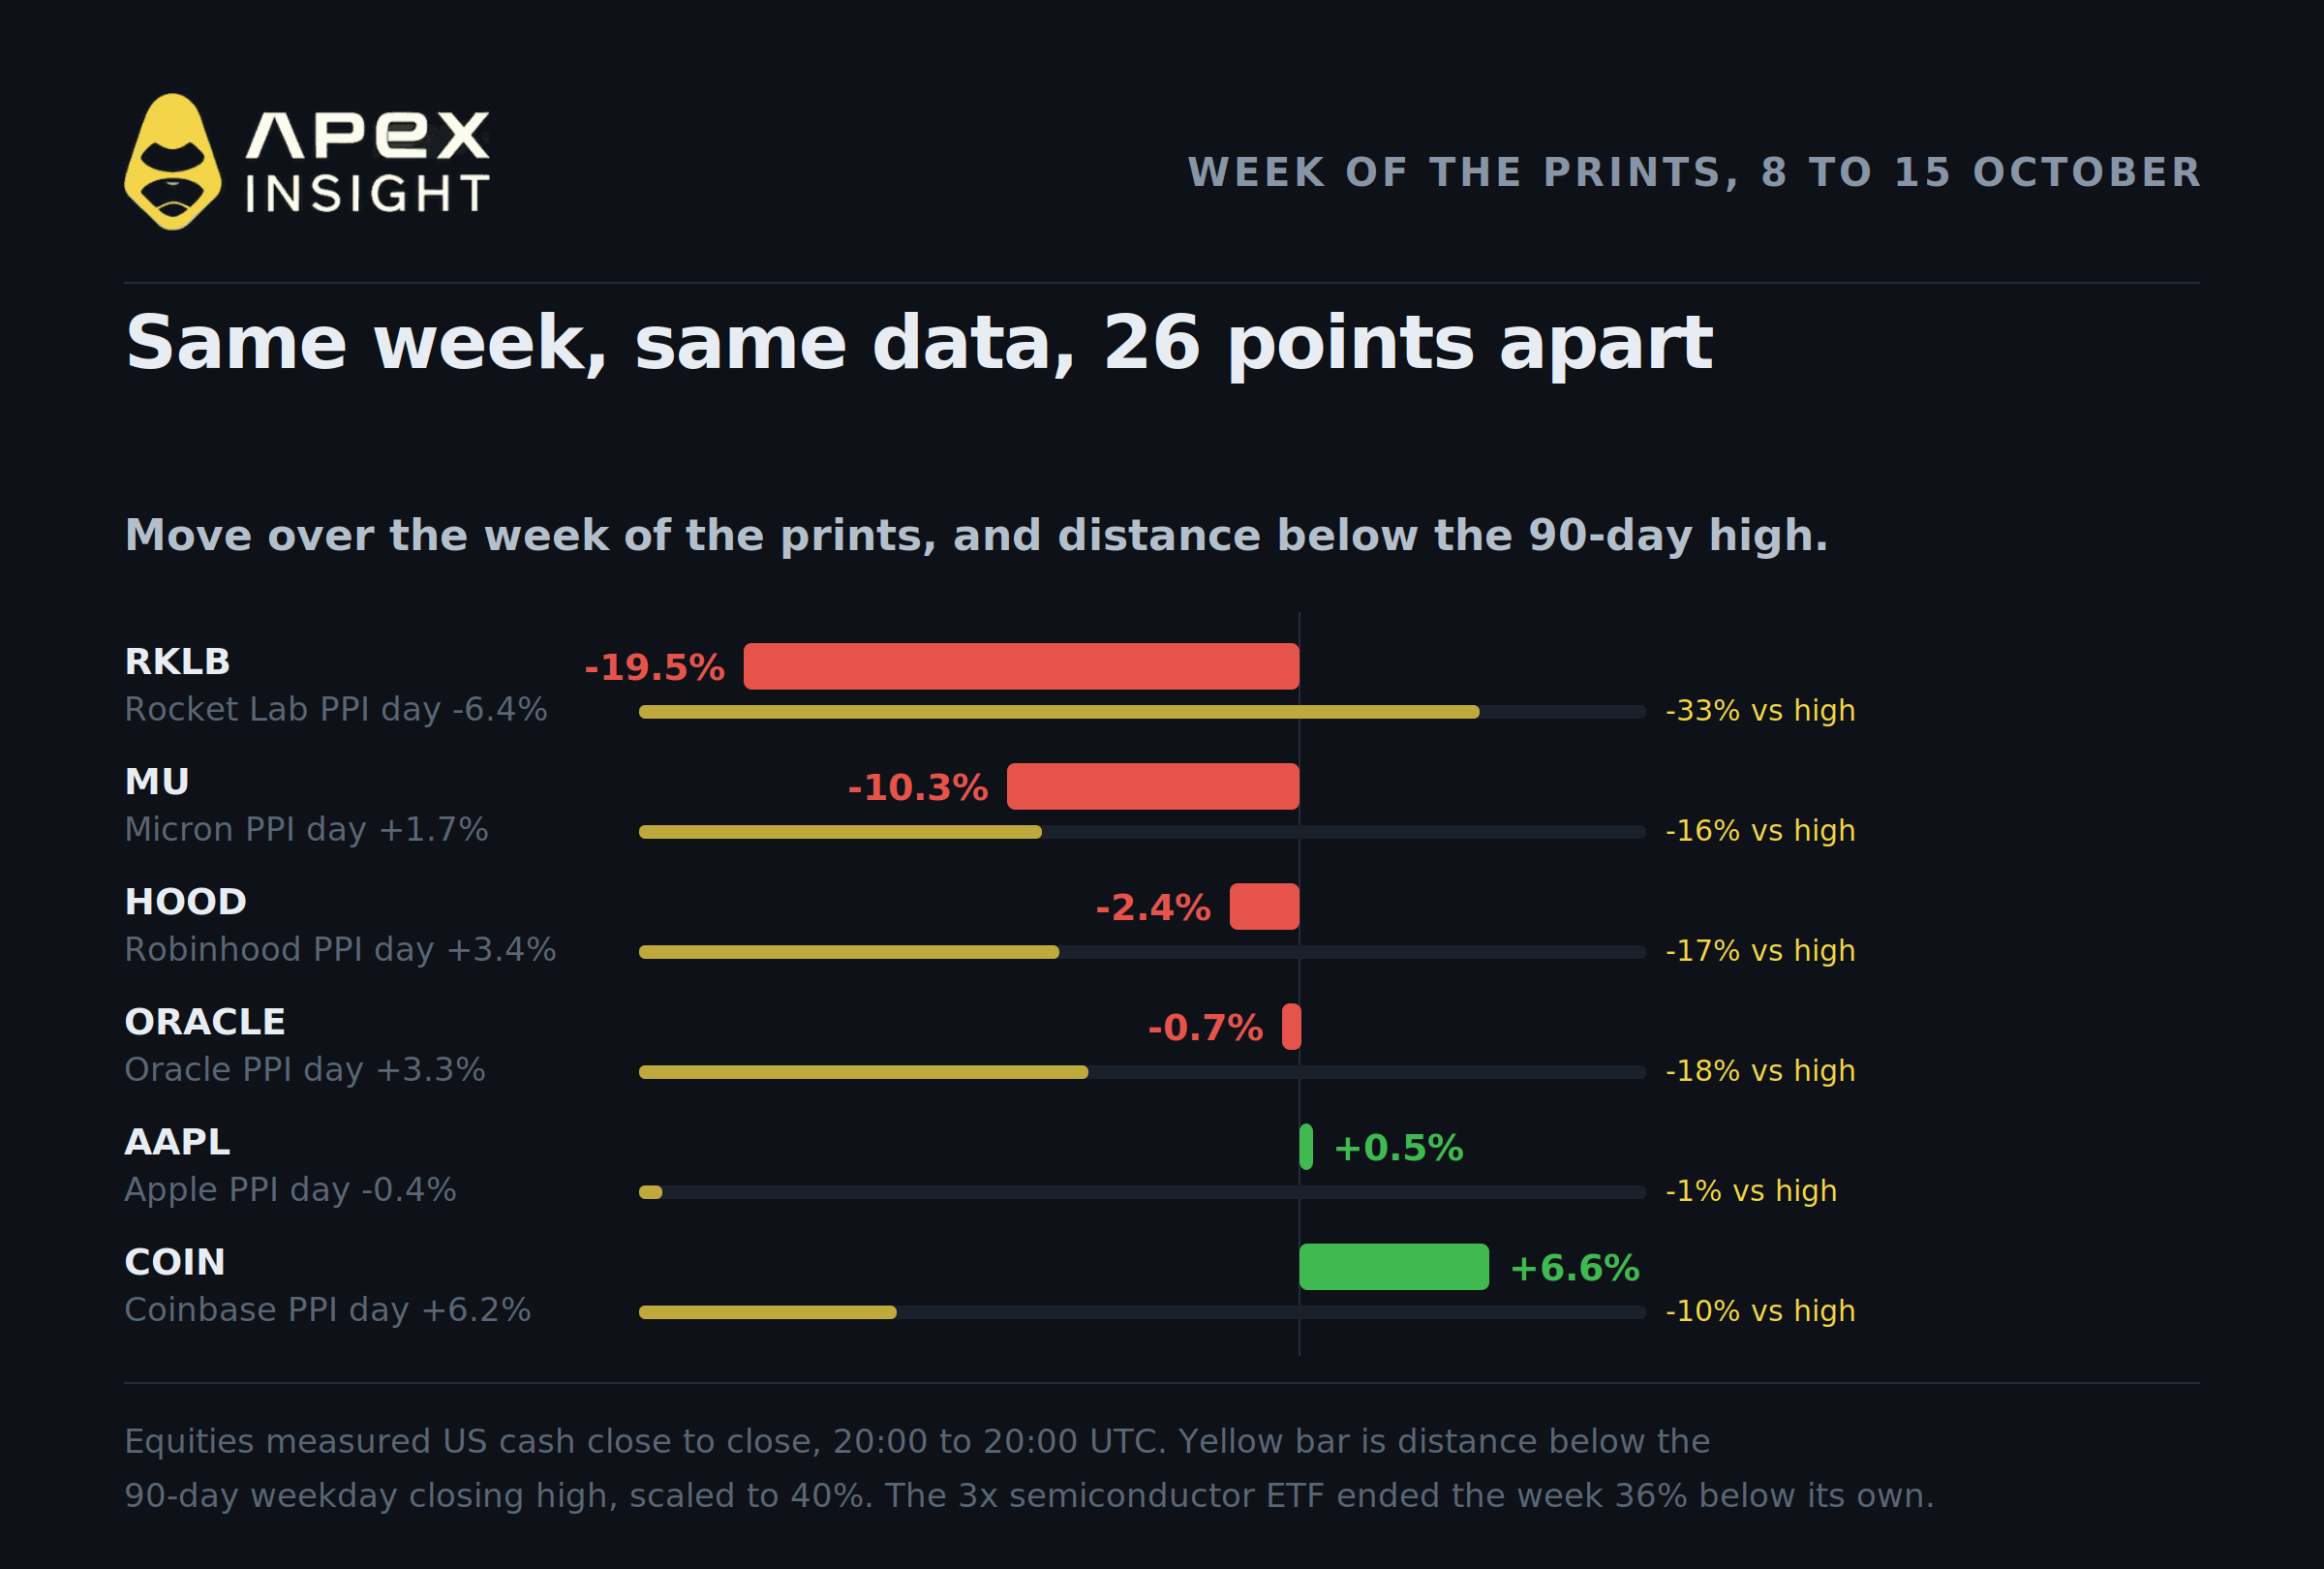
Six stocks to watch
Same week, same three releases, twenty-six percentage points between the best and worst of these six. Each is wired to a different part of what just happened.
1. Micron — the inflation nobody is modelling yet
MUUSDT · $923.57 · week −10.3% · PPI day +1.7% · 16% below its 90-day high
Here is the counterintuitive part: memory prices are not falling. They are at record highs. Spot DDR5 16Gb hit $59.90 on 13 October, up 10.2% on the month, and 32GB server RDIMM modules have more than doubled in six months. TrendForce has conventional DRAM contract prices rising another 10–15% this quarter.
Micron did not fall because memory got cheaper. It fell because of a single statement made on Saturday 10 October, when CXMT president Cao Kanyu told an industry conference the company had made progress on a 4F² DRAM cell architecture and said the company would launch server DDR5 modules built on it by year-end. Neither Samsung nor SK Hynix has published a firm 4F² timeline, and TrendForce does not expect Samsung's related hybrid-bonding path before 2028 — which is why a year-end claim landed as hard as it did. The claim is unverified, with open questions over yields, leakage and customer qualification, but it reset what the market assumed about future supply. Korean memory names fell on the Monday and Tuesday that followed.
So Micron sits on both sides. Rising memory prices are its revenue line. Future Chinese supply and the AI financing question are the discount applied to it. The behaviour shows which side is winning on a given day: it fell 4.2% in Thursday's overnight window with the Korean complex, then rose 6.8% in the US cash session with the rate-sensitives, closing up 1.7% on the day and down 10.3% on the week.
There may also be a second-order inflation story here. TSMC's Wei warned on Thursday that consumer and price-sensitive end markets are "being challenged by rising component prices," and industry trackers report PC makers trimming SSD capacities to contain bill-of-materials cost. If that pass-through continues it is a goods-price impulse for 2027, not for the print the Fed is looking at now.
Watch: SK Hynix reports 28 October and Samsung 29 October — the cleanest read on whether the CXMT threat is real.
2. Oracle — the most leveraged balance sheet in AI
ORACLEUSDT · $134.47 · week −0.7% · PPI day +3.3% · 18% below its 90-day high
Oracle carries the largest debt load of any name in the AI infrastructure build. On a lease-inclusive basis it stood at about $167bn at its fiscal year end on 31 May 2026, and roughly $169bn at the quarter ended 31 August, against $37.1bn of cash. The cash burn is the part that moved: a free cash flow deficit of $23.7bn in fiscal 2026 had become roughly $28.7bn on a trailing-four-quarter basis by August, on $75.7bn of capital expenditure. (Definitions vary between filings and vendors — the narrower "notes payable" line is about $125–130bn — so compare like with like before drawing conclusions.)
S&P cut the rating to BBB− in July, one notch above junk, citing customer concentration in a backlog that has since grown to $664bn; press reports put a very large share of it with OpenAI, which Oracle has not confirmed. Oracle's five-year credit default swaps reached about 203 basis points in early October, an eighteen-year high.
For a balance sheet shaped like that, the long end of the Treasury curve is not background. It is an input into the cost of the strategy. Thursday's thirty-year yield fell about ten basis points, and the ApeX contract gained 3.3% cash-to-cash, in line with the roughly 3% rise in the share. That is the cleanest duration trade on this list, and it runs both ways — the contract fell 9.1% on Wednesday when CPI pushed yields the other way.
Watch: Oracle has not confirmed a 2026 analyst meeting, so the next scheduled catalyst is second-quarter results, currently estimated for December and not yet confirmed. In the meantime the tell is credit, not equity: the CDS level, which hit that 203bp high in early October, and the pricing of its Project Jupiter loan, quoted in the high eighties to around 90 cents through late September and October. Both are worth re-checking on the day you read this.
3. Apple — the one that fell while everything rallied
AAPLUSDT · $342.09 · week +0.5% · PPI day −0.4% · 1% below its 90-day high
Apple was one of only two of the 43 contracts tracked here that fell during Thursday's seven-hour rally. It is also sitting within one per cent of its 90-day high while the 3x semiconductor ETF is 36% below its own.
Both facts share a cause: Apple buys memory, it does not sell it. Record DRAM and NAND contract prices are a gross margin problem arriving on roughly an annual lag, and the cost pressure is already visible — PC makers are trimming SSD capacities and smartphone production is being held back by component costs. TSMC's Wei flagged the same thing on Thursday, warning that consumer and price-sensitive end markets are being challenged by rising component prices.
And in a week when the market rotated out of financed growth into everything else, Apple was already in the "everything else" bucket. It had nothing to re-rate, because it never carried the AI-capex premium.
That makes it the control variable. If the memory-cost thesis is real, it shows up here before anywhere else on this list.
Watch: FQ4 results on 2 November, specifically whether component costs appear in the margin guide.
4. Robinhood — the one that wants higher-for-longer
HOODUSDT · $103.43 · week −2.4% · PPI day +3.4% · 17% below its 90-day high
The contrarian entry. For most names here a December hike is a cost. For Robinhood, net interest on customer cash is a revenue line, and a higher-for-longer path is straightforwardly good for it.
The offset is that it is also among the highest-beta expressions of retail risk appetite on the board, so a rate path that helps the interest line often hurts the volume line. Those two forces have been fighting all month.
Watch: third-quarter results on 27 October — the day before the Fed decides. The sequencing is awkward: the market gets the earnings without the decision.
5. Coinbase — the cleanest bet that the hike is off
COINUSDT · $181.39 · week +6.6% · PPI day +6.2% · 10% below its 90-day high
The best performer of the six, in the week inflation ran hottest. That is not a contradiction — it is the point. Coinbase is the most direct equity expression of "the market stopped pricing the October hike," and it gained 9.0% in Thursday's post-print cash session alone.
The honest caveat is that the simpler explanation may just be crypto beta: Circle rose 9.7% on the day, MicroStrategy 5.6% and Bitmine 4.9%, so Coinbase was moving with its sector rather than uniquely with rates. The two readings are hard to separate on one session, and anyone treating this as a pure rates proxy should size it as what it is — a high-beta crypto equity that also happens to be rate-sensitive.
Watch: it unwinds in the same order. If December firms toward a certainty, this is the first of the six to give the move back.
6. Rocket Lab — what a one-year delay costs at a 2008 real rate
RKLBUSDT · $55.74 · week −19.5% · PPI day −6.4% · 33% below its 90-day high
The worst performer here, and the one with the clearest company-specific cause — which is exactly why it is instructive.
After the close on Wednesday 14 October, Rocket Lab announced that manufacturing defects in the forward dome of Neutron's first-stage propellant tank would push the rocket's first launch from the fourth quarter of 2026 into 2027, with no firm date set. CEO Peter Beck said the defects "don't necessarily mean that the dome would fail on flight." A replacement dome will be built and inspected before full first-stage assembly, which the company expects in the first quarter.
The stock had already closed down 7.85% that day in the CPI selloff. It then fell somewhere between 6% and 10% in after-hours trading depending on which print you take and, on Thursday, dropped as much as 16% intraday before closing down about 6.5%; the ApeX contract finished the cash session 6.4% lower. KeyBanc cut its target to $100 from $135 and Clear Street to $105 from $129 — both keeping positive ratings, which tells you the delay is seen as timing rather than viability.
Two lessons sit in that sequence.
The first is about the rate environment. Rocket Lab has almost no near-term earnings, so nearly all of its value sits in cash flows far enough out that the discount rate dominates. With the real yield at its highest since 2008, pushing a revenue inflection back twelve months costs far more than the same delay would have cost three years ago. The rate backdrop did not cause the delay — but it set the price of one.
The second is about the contract. That 10.1% overnight drop was the largest of the 43 contracts tracked here, and it had nothing to do with Korean memory or inflation. It was the after-hours reaction to a press release, captured in a window where the ApeX contract trades and the share does not. Contract holders took the hit at two in the morning. Shareholders took it at the opening bell.
Watch: if December pricing softens, this should lead on the way back. If it does not, the problem is not the discount rate.
How the rest of the board is positioned
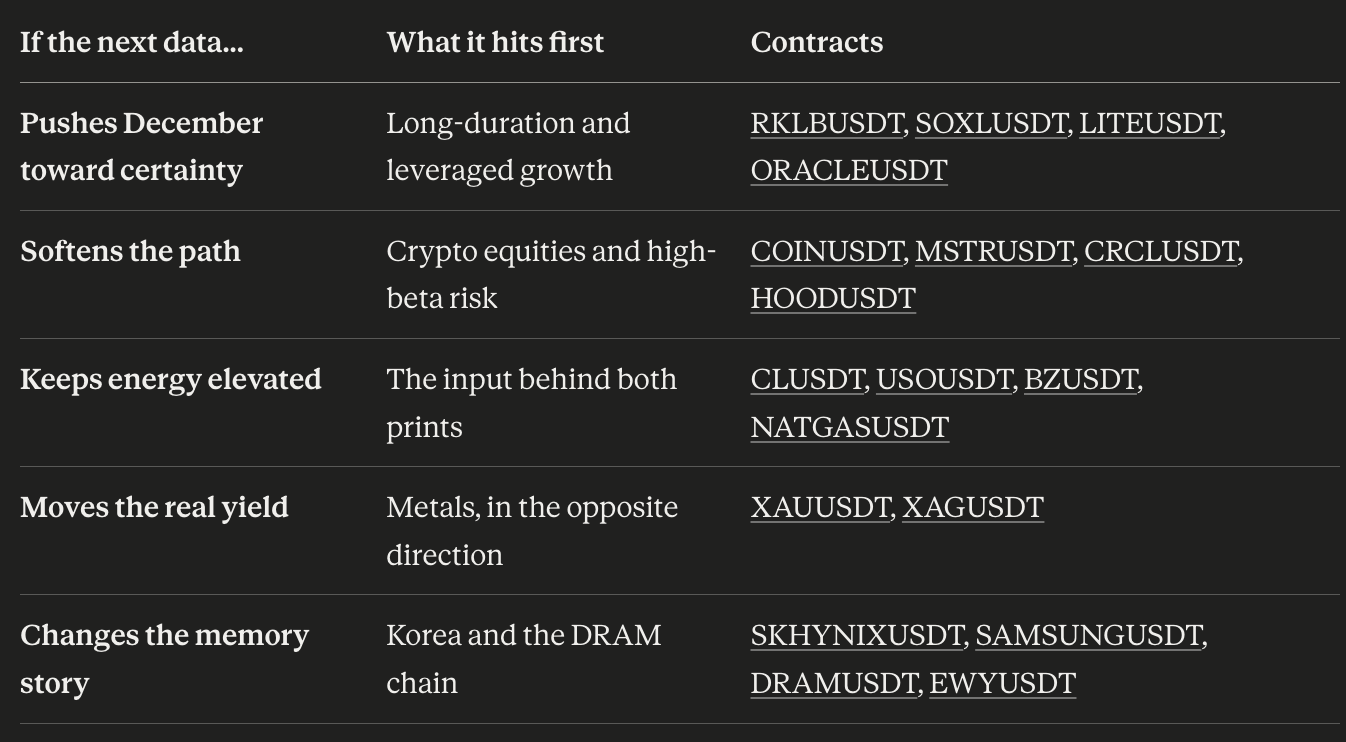
What to watch next
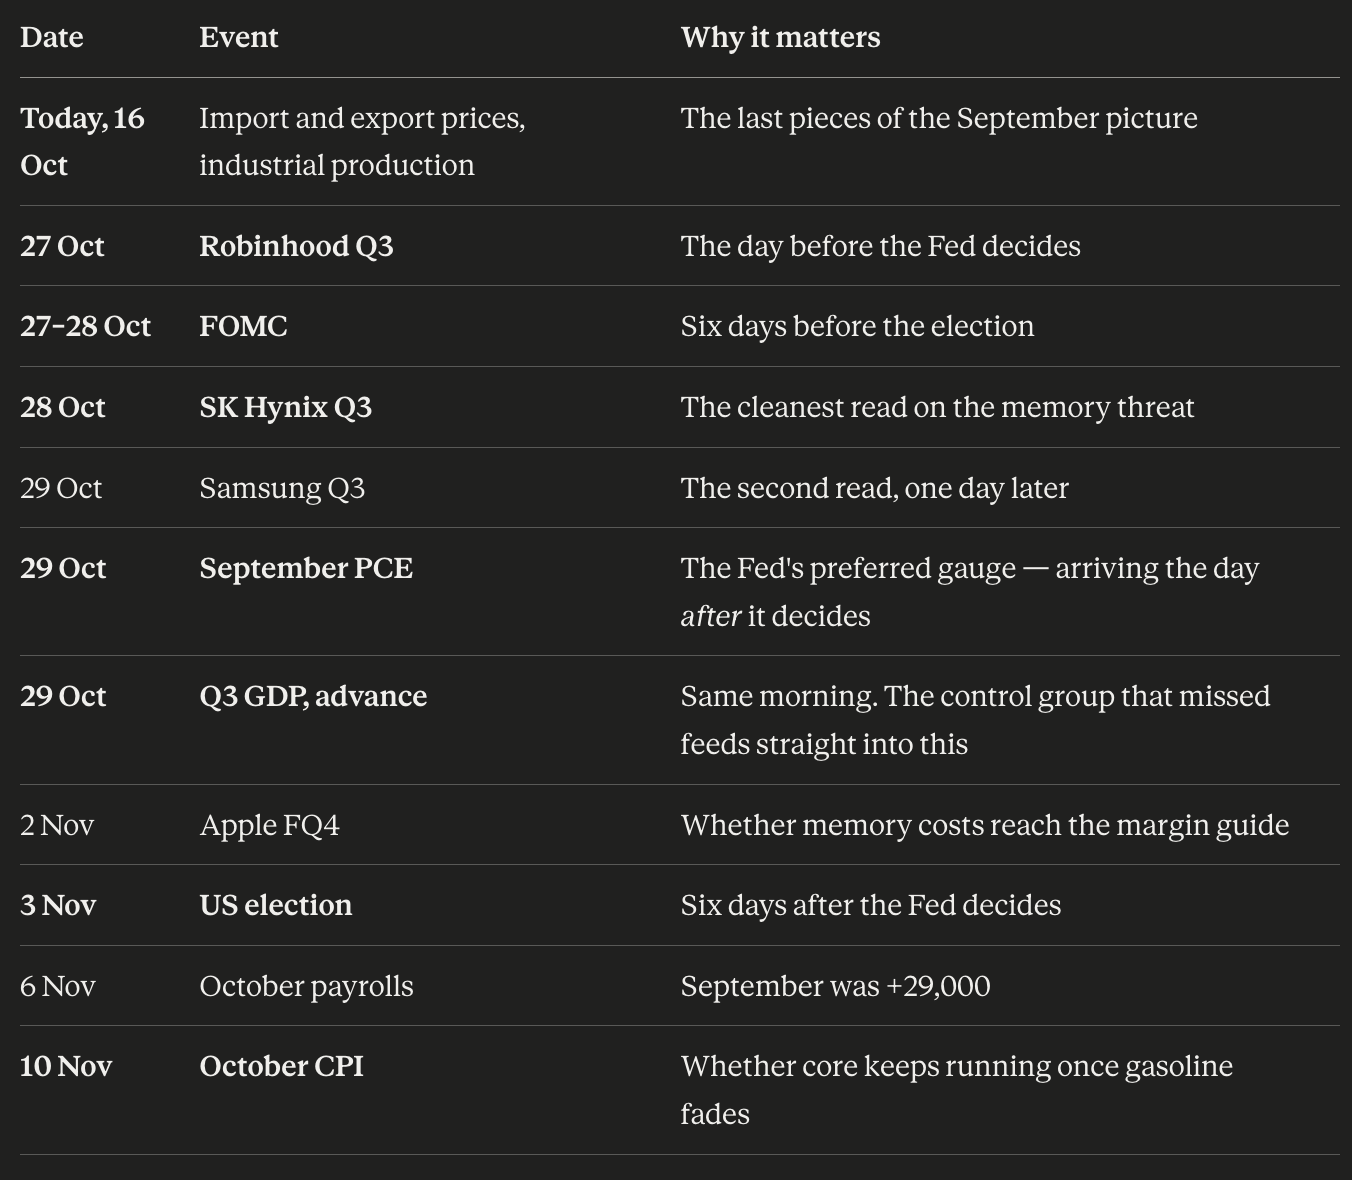
The through-line is that this week handed the market the hottest inflation data in four years, and the market used it to buy bonds and rotate out of AI. The best-informed company in the chain said demand is accelerating, and its stock fell anyway.
If that is right, the next move in these six names will not come from an inflation print. It will come from whatever settles whether the capital expenditure cycle is funded — and the first real answer arrives on 28 October, when the Fed decides and SK Hynix reports within a day of each other.
Trade the markets in this article
Every contract named above is live on ApeX Omni against USDT, in one account on one margin balance. The links go straight to the order book.
The six to watch: MUUSDT · ORACLEUSDT · AAPLUSDT · HOODUSDT · COINUSDT · RKLBUSDT
The memory and semiconductor chain: SOXLUSDT · SKHYNIXUSDT · SAMSUNGUSDT · DRAMUSDT · EWYUSDT · NVDAUSDT · LITEUSDT
Energy — the input behind both prints: CLUSDT · USOUSDT · BZUSDT · NATGASUSDT
The real-rate trade: XAUUSDT · XAGUSDT
Crypto and the benchmarks: BTCUSDT · ETHUSDT · MSTRUSDT · CRCLUSDT · SPYUSDT · QQQUSDT
Two things to carry in with you. The equity and commodity contracts settle against an index rather than the share or the barrel, and ApeX classifies them in its own contract data as stock contracts rather than perpetuals — worth checking against the terms if you are trading one to qualify for a volume promotion written around "perpetual" volume. And they run twenty-four hours while the thing they track does not. Rocket Lab made that concrete this week: a press release after the US close moved the contract 10% before the share had any chance to open.
Price and return data are from ApeX Omni contract data. Quoted price levels are as of roughly 09:00 UTC on 16 October 2026, within an incomplete trading day and before the US open, so they will have moved by the time you read this. Equity contract moves are measured US cash close to close, 20:00 to 20:00 UTC, because ApeX prints calendar-day bars while the underlying shares trade only 13:30-20:00; the 24-hour markets use the calendar day, except in the session-decomposition chart where every contract is anchored 20:00 to 20:00 so the segments reconcile to the net. ApeX hourly bars are start-stamped, so the bar stamped 12:00 covers the 12:30 release. CPI, PPI and import and export price figures are from the Bureau of Labor Statistics; retail sales are the Census Bureau advance estimate; Oracle balance-sheet figures are from its FY2026 filing to 31 May 2026 and its quarter ended 31 August 2026, as labelled. Rate probabilities are from CME FedWatch and from Kalshi and Polymarket as noted; they differ materially by venue and by whether they price a move at a given meeting or by it, and both constructs are labelled above where quoted. Treasury yield changes for 15 October differ by up to four basis points across sources depending on snapshot time, and are given here as ranges for that reason. Treasury yields, index and sector returns, memory pricing and company figures are from the sources named inline. Nothing here is investment advice; tokenised stock perpetuals carry leverage risk and settle against an index rather than the share itself.